Dax Function: VARX.S
 Reviewed by Neetu Singla — Founder, Lets Viz Technologies — AI & Data Consultant. Last reviewed June 5, 2026.
Category: Statistical Functions
The VARX.S function in Power BI is a DAX (Data Analysis Expressions) function used to calculate the variance of a sample dataset based on an expression evaluated for each row in a table. It allows flexibility by computing variance dynamically for a specified expression, rather than relying on static column data.
Purpose
The VARX.S function is used to:
Analyze the variability of calculated values over a sample dataset.
Perform variance analysis for rows meeting specific conditions or filters.
Support advanced statistical and analytical calculations in reports.
Type of Calculations
Sample Variance: Measures how spread out values are in a sample, using a user-defined expression for calculations.
Unlike VAR.S, VARX.S applies variance computation to dynamically calculated values rather than pre-existing column data.
Practical Use Cases
Sales Variability: Analyze the variance in sales performance across regions or products.
Custom Metrics Analysis: Measure variability of calculated KPIs, such as profit margins or customer satisfaction scores.
Dynamic Segmentation: Compute variance dynamically based on conditions like seasonal trends or demographic filters.
VARX.S(<table>, <expression>)</expression></table>
| Parameter | Type | Description |
|---|---|---|
<Table> | Table | The table containing the data for which the variance is calculated. |
<Expression> | Expression | A DAX expression that is evaluated for each row of the table. |
How Does VARX.S Dax Works
The VARX.S function uses the formula for sample variance:
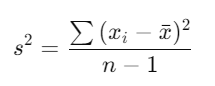
Where:
xi = Each value evaluated from the expression.
x̄ = Mean of the evaluated values.
n = Number of data points in the sample.
The Expression is evaluated for each row in the Table.
The mean (x̄) of the evaluated results is calculated.
Deviations from the mean are squared, summed, and divided by n − 1 sumes the data is a sample, not the entire population.
What Does It Return?
Type: Decimal number.
Meaning: Returns the variance of the evaluated expression for the sample dataset.
When Should We Use It?
When the dataset represents a sample, not a population.
For calculating variance of a dynamically evaluated expression, especially when working with complex data models or filters.
To analyze variability of custom metrics across a subset of data.
Examples
Basic Usage :
VARX.S(Products, Products[Revenue] - Products[Cost])
Result: Calculates the sample variance of profit (Revenue – Cost) for all rows in the Products table.
Column-Based Usage
VARX.S(Sales, Sales[Quantity] * Sales[Price])
Result: Computes the sample variance of total sales for each row by multiplying Quantity and Price.
Advanced Usage
VARX.S(
FILTER(Sales, Sales[Region] = "North"),
Sales[Revenue] - Sales[Discount]
)
Result: Calculates the sample variance of net revenue (Revenue – Discount) for rows in the Sales table where Region is “North”.
Tips and Tricks
Filter Data Carefully: Use
FILTERor other DAX functions to isolate subsets of data for focused variance analysis.Optimize Expressions: Simplify expressions for better performance in large datasets.
Combine with Related Functions: Pair with AVERAGEX to understand the mean before analyzing variance.
Common Pitfalls
Providing invalid or non-numeric expressions will result in errors.
Ensure that the dataset represents a sample; otherwise, use VARX.P for population variance.
Performance Impact of VARX.S DAX Function:
Dynamic Expressions: Evaluate expressions that minimize computational complexity for faster performance.
Filters: Apply filters judiciously to reduce the size of the evaluated dataset and improve speed.
Related Functions You Might Need
Want to Learn More?
For more information, check out the official Microsoft documentation for VARX.S You can also experiment with this function in your Power BI reports to explore its capabilities.
Unlock the true power of Power BI and turn your data into actionable insights with the help of our skilled consulting team. From advanced DAX calculations and building engaging dashboards to refining data models for optimal performance, our experienced Power BI experts deliver solutions customized to your unique business requirements. Check out our Power BI Consulting Services page to see how we can assist your organization in driving smarter, data-informed strategies.
The VARX.S function calculates the sample variance of a dynamic expression evaluated over a table.
VARX.S evaluates a custom expression for variance, while VAR.S computes variance directly for a column.
Yes, use DAX functions like FILTER to apply conditions before evaluating the variance.
It returns the sample variance of the evaluated expression as a decimal value.
Use VARX.S for sample data and VARX.P for population data.
Need Power BI help in a real engagement?
Our team writes DAX like this every day for SaaS finance and ops teams. Refresh monitoring, change requests with a 2-business-day SLA, and a named analyst on retainer — or scoped hourly help if you just need a fix.
Named analyst2-day SLAFrom $5K/mo
