Dax Function: CHISQ.DIST
 Reviewed by Neetu Singla — Founder, Lets Viz Technologies — AI & Data Consultant. Last reviewed June 5, 2026.
Category: Statistical Functions
The CHISQ.DIST function in Power BI calculates the chi-squared distribution value for a given input. The chi-squared distribution is widely used in hypothesis testing and confidence interval estimation, particularly in tests of independence and goodness-of-fit tests.
Purpose of the Function
Compute the probability density or cumulative probability for the chi-squared distribution.
Type of Calculations
Calculates either the cumulative distribution function (CDF) or the probability density function (PDF) for the chi-squared distribution.
Practical Use Cases
- Statistical hypothesis testing (e.g., Chi-Square Test for Independence).
- Analyzing the distribution of variance in datasets.
- Evaluating model goodness-of-fit in machine learning or statistics.
CHISQ.DIST(x, deg_freedom, cumulative)
| Parameter | Type | Description |
|---|---|---|
x | Scalar | The value at which to evaluate the distribution. Must be greater than or equal to 0. |
deg_freedom | Scalar | The degrees of freedom for the chi-squared distribution. Must be greater than 0. |
cumulative | Boolean | A logical value that determines the type of distribution to compute: |
– TRUE: Calculates the cumulative distribution function (CDF). | ||
– FALSE: Calculates the probability density function (PDF). |
How Does CHISQ.DIST Dax Works
The chi-squared distribution is a statistical distribution with a single parameter: degrees of freedom (deg_freedom). For CHISQ.DIST:
CDF: Computes the area under the curve from 0 to
x.PDF: Computes the value of the probability density function at
x.
Formula for PDF
The probability density function for the chi-squared distribution is given by:
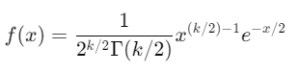
Where:
k = degrees of freedom.
= gamma function.
What Does It Return?
The function returns a numeric value:
CDF (
cumulative = TRUE): A probability that describes the likelihood of observing a value less than or equal tox.PDF (
cumulative = FALSE): The height of the probability density function atx.
When Should We Use It?
Use the CDF (
cumulative = TRUE) when determining the probability of an event occurring within a given range.Use the PDF (
cumulative = FALSE) when analyzing the likelihood of specific values in a dataset.Ideal for chi-square tests in statistics, particularly for categorical data.
Examples
Basic Usage :
Calculate the cumulative probability for x = 5 with 4 degrees of freedom:
CHISQ.DIST(5, 4, TRUE)
Output: 0.7127 (approximately, the cumulative probability for x=5).
Column Usage
Evaluate the probability density for a column of chi-square values:
CHISQ.DIST(Table[ChiSquareValues], 3, FALSE)
This computes the PDF for each value in the column ChiSquareValues with 3 degrees of freedom.
Advanced Usage
Combine with conditional logic to flag significant values:
IF(CHISQ.DIST(Table[ChiSquareValues], 4, TRUE) < 0.05, "Significant", "Not Significant")
This identifies rows where the cumulative probability indicates a significant result at a 5% threshold.
Tips and Tricks
Interpretation: A higher CDF value indicates that the given
xis more probable under the chi-squared distribution.Degrees of Freedom: Understand the degrees of freedom parameter—it significantly affects the shape of the distribution.
Bounds: Ensure that
xis greater than or equal to 0 anddeg_freedomis positive to avoid errors.
Potential Pitfalls
Invalid Inputs: The function will return an error if
xis negative or ifdeg_freedomis less than or equal to 0.Overfitting: Use caution when interpreting chi-squared results in small datasets to avoid misleading conclusions.
Performance Impact of CHISQ.DIST DAX Function:
Efficient for most datasets but can be computationally intensive for high
deg_freedomvalues or large datasets.Pre-calculate results for static values to improve report performance.
Related Functions You Might Need
Want to Learn More?
For more information, check out the official Microsoft documentation for CHISQ.DIST You can also experiment with this function in your Power BI reports to explore its capabilities.
Unlock the full capabilities of Power BI and elevate your data insights with our specialized consulting services. Whether you need guidance on advanced DAX functions like those highlighted here, support in designing interactive dashboards, or expertise in optimizing data models for enhanced performance, our experienced Power BI consultants are equipped to deliver customized solutions for your business. Explore our Power BI Consulting Services page to discover how we can help your organization make smarter, data-driven decisions.
It calculates either the probability density or cumulative probability for a chi-squared distribution.
It is commonly used in hypothesis testing, model validation, and goodness-of-fit evaluations.
Cumulative = TRUE computes the CDF, while Cumulative = FALSE computes the PDF.
Degrees of freedom define the shape of the chi-squared distribution and affect its skewness.
Ensure that x is non-negative and deg_freedom is greater than 0 to avoid errors.
Need Power BI help in a real engagement?
Our team writes DAX like this every day for SaaS finance and ops teams. Refresh monitoring, change requests with a 2-business-day SLA, and a named analyst on retainer — or scoped hourly help if you just need a fix.
Named analyst2-day SLAFrom $5K/mo
