Dax Function: STDEVX.P
 Reviewed by Neetu Singla — Founder, Lets Viz Technologies — AI & Data Consultant. Last reviewed June 5, 2026.
Category: Statistical Functions
The STDEVX.P function in Power BI is a DAX (Data Analysis Expressions) function used to calculate the population standard deviation of values generated by an expression evaluated across a table. This function is part of the X family of aggregation functions that support row-by-row evaluation.
Purpose
The STDEVX.P function helps determine the population standard deviation, which measures the dispersion of a dataset relative to its mean. It is particularly useful for scenarios where the data represents the entire population rather than a sample.
Type of Calculations
The function performs:
Row-by-row evaluation of a user-defined expression.
Aggregation of results to calculate the standard deviation for the entire population.
Practical Use Cases
Complete Population Analysis: Analyze the variability in datasets representing an entire population, such as all customers, sales records, or transactions.
Derived Metrics: Evaluate standard deviation for dynamically computed metrics (e.g., profit margins, growth rates).
Segmented Analysis: Assess variability across specific categories or segments in your data.
STDEVX.P(<table>, <expression>)</expression></table>
| Parameter | Type | Description |
|---|---|---|
table | Table | The table containing rows to evaluate. |
expression | Expression | A DAX expression evaluated for each row, resulting in numerical values. |
How Does STDEVX.P Dax Works
The STDEVX.P function calculates the population standard deviation using the following formula:
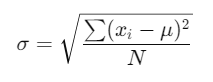
Where:
μ = Mean of the derived values.
N = Total number of rows.
Process:
Row Evaluation: The
expressionis calculated for each row in the specifiedtable.Mean Calculation: Compute the mean (μ) of these values.
Squared Deviations: Calculate the squared differences between each value and the mean.
Normalization: Divide the total of squared deviations by N, the number of rows.
Square Root: Take the square root to obtain the standard deviation.
What Does It Return?
Type: Decimal number.
Meaning: The function returns the population standard deviation of the results obtained by evaluating the expression.
When Should We Use It?
When analyzing complete population datasets for statistical insights.
In scenarios where derived metrics are used for population-level variability assessment.
When you need precise results for datasets where no sampling is involved.
Examples
Basic Usage :
STDEVX.P(Orders, Orders[Quantity] * Orders[UnitPrice])
Result: Calculates the population standard deviation of total order values derived from multiplying Quantity and UnitPrice.
Column Usage
Assume a table Products with columns Cost and Price:
STDEVX.P(Products, Products[Price] - Products[Cost])
Result: Computes the population standard deviation of profit margins.
Advanced Usage
Combine with CALCULATE and FILTER:
STDEVX.P(FILTER(Sales, Sales[Region] = "North"), Sales[Revenue] / Sales[UnitsSold])
Result: Computes the population standard deviation of revenue per unit for the “North” region.
Tips and Tricks
Optimize Expression Logic: Simplify expressions for better performance on large datasets.
Handle Missing Values: Use ISNUMBER or IF to filter out null or non-numerical results.
Combine with Other Functions: Enhance insights by pairing with AVERAGEX, SUMMARIZE, or CALCULATE for custom groupings.
Potential Pitfalls
Performance may degrade with large datasets due to row-by-row evaluation.
Non-numerical results in the expression will cause errors.
Performance Impact of STDEVX.P DAX Function:
Pre-filter tables using FILTER or CALCULATE to reduce the dataset size before applying the function.
Avoid complex expressions that require excessive computation.
Related Functions You Might Need
Want to Learn More?
For more information, check out the official Microsoft documentation for STDEVX.P You can also experiment with this function in your Power BI reports to explore its capabilities.
Maximize what Power BI can do for your business by turning raw data into powerful insights, guided by our expert consulting team. Whether you need assistance with sophisticated DAX functions, crafting intuitive dashboards, or enhancing data model performance, our experienced Power BI consultants deliver customized solutions tailored to your specific goals. Visit our Power BI Consulting Services page to find out how we can help your organization make informed, data-driven decisions.
STDEVX.P evaluates a custom expression row-by-row, while STDEV.P operates on a single column directly.
Non-numerical results in the expression cause errors. Use conditions like ISNUMBER to handle them.
No, for sample data, use STDEVX.S to calculate the sample standard deviation.
Any table where the expression can be evaluated for each row to return numerical results.
It can be computationally intensive for large datasets. Optimize the table and expression to improve performance.
Need Power BI help in a real engagement?
Our team writes DAX like this every day for SaaS finance and ops teams. Refresh monitoring, change requests with a 2-business-day SLA, and a named analyst on retainer — or scoped hourly help if you just need a fix.
Named analyst2-day SLAFrom $5K/mo
