Dax Function: CONFIDENCE.NORM
 Reviewed by Neetu Singla — Founder, Lets Viz Technologies — AI & Data Consultant. Last reviewed June 5, 2026.
Category: Statistical Functions
The CONFIDENCE.NORM function calculates the confidence interval for a population mean, assuming a normal distribution. This interval provides a range within which the true population mean is likely to fall, based on a given confidence level.
Purpose
To provide statistical insights by calculating the margin of error for a population mean using a specified confidence level.
Type of Calculations
Statistical analysis focused on inferential statistics.
Practical Use Cases
- Estimating the range of values for key business metrics (e.g., average sales).
- Analyzing experimental data in research and development.
- Performing quality control and process improvement analyses.
CONFIDENCE.NORM(alpha, standard_dev, size)
| Parameter | Type | Description |
|---|---|---|
alpha | Scalar | The significance level (1 – confidence level). Must be a value between 0 and 1. |
standard_dev | Scalar | The standard deviation of the population. Must be a positive number. |
size | Scalar | The sample size. Must be a positive integer. |
How Does CONFIDENCE.NORM Dax Works
The CONFIDENCE.NORM function is based on the formula:
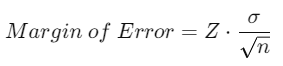
Where:
Z: The Z-score corresponding to the specified confidence level.
σ: The standard deviation of the population (
standard_dev).n: The sample size (
size).
Mathematical Principles
The Z-score is derived from the standard normal distribution (mean = 0, standard deviation = 1).
The margin of error is scaled by the standard deviation and inversely proportional to the square root of the sample size.
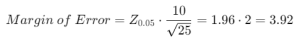
Example
For a 95% confidence level (α=0.05), with a population standard deviation of 10 and a sample size of 25:
What Does It Return?
The function returns a numeric value representing the margin of error for the population mean based on the specified confidence level. This value can be added to and subtracted from the sample mean to calculate the confidence interval.
When Should We Use It?
Estimating the precision of sample-derived metrics.
Evaluating variability in survey results or experimental data.
Creating reports that require confidence intervals for decision-making.
Examples
Basic Usage :
Calculate the margin of error for a 90% confidence level, standard deviation of 12, and sample size of 30:
CONFIDENCE.NORM(0.10, 12, 30)
Output: 3.844
Column Usage
Use the function in a calculated column:
CONFIDENCE.NORM(0.05, Table[StandardDeviation], Table[SampleSize])
This dynamically calculates the margin of error for each row in the table.
Advanced Usage
Combine CONFIDENCE.NORM with other DAX functions:
VAR MarginError = CONFIDENCE.NORM(0.05, 10, 100)
RETURN [SampleMean] + MarginError
This adds the margin of error to a sample mean to calculate the upper limit of the confidence interval.
Tips and Tricks
Accurate Inputs: Ensure accurate values for
alpha,standard_dev, andsizefor meaningful results.Small Sample Sizes: For small sample sizes or unknown population standard deviation, consider using
CONFIDENCE.T.Visualize Results: Use a line chart to display confidence intervals for better interpretability.
Potential Pitfalls
Incorrect values for
alphacan lead to invalid confidence levels.A very small sample size may produce unreliable confidence intervals.
Performance Impact of CONFIDENCE.NORM DAX Function:
Efficient for datasets with pre-computed inputs (e.g., standard deviation and sample size).
For dynamic calculations, ensure sample size and standard deviation data are pre-aggregated.
Related Functions You Might Need
CONFIDENCE.T: Similar to
CONFIDENCE.NORM, but for Student’s t-distribution.AVERAGE: To calculate the sample mean.
STDEV.P: To calculate the population standard deviation.
Want to Learn More?
For more information, check out the official Microsoft documentation for CONFIDENCE.NORM You can also experiment with this function in your Power BI reports to explore its capabilities.
Unlock the full capabilities of Power BI and elevate your data insights with our specialized consulting services. Whether you need guidance on advanced DAX functions like those highlighted here, support in designing interactive dashboards, or expertise in optimizing data models for enhanced performance, our experienced Power BI consultants are equipped to deliver customized solutions for your business. Explore our Power BI Consulting Services page to discover how we can help your organization make smarter, data-driven decisions.
It calculates the margin of error for a population mean using a normal distribution.
CONFIDENCE.NORM assumes a normal distribution, while CONFIDENCE.T is used for smaller samples and assumes a t-distribution.
No, standard_dev and size must be positive. However, alpha must be between 0 and 1.
The confidence interval may not be reliable. Consider using CONFIDENCE.T for small sample sizes.
A smaller alpha (e.g., 0.01) results in a larger confidence interval, reflecting higher confidence.
Need Power BI help in a real engagement?
Our team writes DAX like this every day for SaaS finance and ops teams. Refresh monitoring, change requests with a 2-business-day SLA, and a named analyst on retainer — or scoped hourly help if you just need a fix.
Named analyst2-day SLAFrom $5K/mo
