Dax Function: NORM.DIST
 Reviewed by Neetu Singla — Founder, Lets Viz Technologies — AI & Data Consultant. Last reviewed June 5, 2026.
Category: Statistical Functions
The NORM.DIST function in Power BI is a statistical DAX function that calculates the normal (Gaussian) distribution for a given value, mean, and standard deviation. It can be used to evaluate the probability density or cumulative probability of a value in a normal distribution.
Purpose of the Function
To calculate either the probability density function (PDF) or the cumulative distribution function (CDF) for a normal distribution.
Type of Calculations
- Probabilistic analysis
- Statistical modeling
Practical Use Cases
- Compute probabilities for a value being within a certain range in a dataset.
- Evaluate risks or deviations in data for predictive modeling.
- Assess probabilities in financial or quality control applications.
NORM.DIST(<x>, <mean>, <standard_deviation>, <cumulative>)</cumulative></standard_deviation></mean></x>
| Parameter | Type | Description |
|---|---|---|
<X> | Scalar | The value for which you want the distribution. |
<Mean> | Scalar | The mean (average) of the distribution. |
<Standard_deviation> | Scalar | The standard deviation of the distribution. |
<Cumulative> | Boolean | A logical value indicating the function type: |
TRUE for cumulative distribution (CDF) and FALSE for probability density (PDF). |
How Does NORM.DIST Dax Works
Mathematical Principle
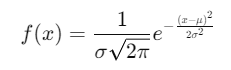
Probability Density Function (PDF):
Where:
x: Value for which the density is calculated.
μ: Mean.
σ: Standard deviation.
Cumulative Distribution Function (CDF):
The integral of the PDF from −∞ to x.
Execution in DAX
Accepts input parameters ( x, μ, σ ).
Determines whether to calculate PDF or CDF based on the
Cumulativeparameter.Returns the result as a probability or density.
What Does It Return?
The NORM.DIST function returns:
A numeric value representing:
CDF: The cumulative probability for
XwhenCumulativeisTRUE.PDF: The height of the probability density curve for
XwhenCumulativeisFALSE.
When Should We Use It?
Risk Analysis: To understand the likelihood of values falling within certain thresholds.
Statistical Predictions: For modeling probabilities in financial forecasting.
Quality Control: To evaluate deviations from a mean in production data.
Examples
Basic Usage :
Calculate the probability density for a value of 70, with a mean of 60 and standard deviation of 10:
NORM.DIST(70, 60, 10, FALSE)
Output: The probability density at x = 70.
Column Usage
Calculate the cumulative distribution for a column of sales data:
SUMX(
Sales,
NORM.DIST(Sales[Amount], 500, 50, TRUE)
)
Use Case: Aggregate cumulative probabilities for sales data.
Advanced Usage
Combine with IF to evaluate high-probability values:
IF(
NORM.DIST(Sales[Amount], 500, 50, TRUE) > 0.95,
"High Probability",
"Low Probability"
)
Use Case: Categorize sales amounts based on their likelihood.
Tips and Tricks
Validate Parameters: Ensure standard deviation (σ) is positive; otherwise, the function will return an error.
Use for Normalized Data: This function assumes a normal distribution. Use preprocessing if your data is not normally distributed.
Optimize Filters: Combine with
CALCULATEfor filtering subsets of data.
Performance Impact of NORM.DIST DAX Function:
For large datasets, consider columnar operations for efficiency.
Avoid excessive calls to
NORM.DISTwithin loops or iterative functions to reduce computation time.
Related Functions You Might Need
NORM.INV: Calculates the inverse of the normal cumulative distribution.
STDEV.P/STDEV.S: Computes standard deviations, often used with
NORM.DIST.PERCENTILEX.INC: Calculates percentiles for a dataset.
Want to Learn More?
For more information, check out the official Microsoft documentation for NORM.DIST You can also experiment with this function in your Power BI reports to explore its capabilities.
Unlock the full capabilities of Power BI and elevate your data insights with our specialized consulting services. Whether you need guidance on advanced DAX functions like those highlighted here, support in designing interactive dashboards, or expertise in optimizing data models for enhanced performance, our experienced Power BI consultants are equipped to deliver customized solutions for your business. Explore our Power BI Consulting Services page to discover how we can help your organization make smarter, data-driven decisions.
It calculates the probability density or cumulative probability for a normal distribution.
It specifies whether to calculate the cumulative distribution (TRUE) or probability density (FALSE).
The function will return an error, as standard deviation must be positive.
The function assumes normal distribution; preprocessing may be needed for non-normal data.
It is used in risk analysis, quality control, and predictive statistical modeling.
Need Power BI help in a real engagement?
Our team writes DAX like this every day for SaaS finance and ops teams. Refresh monitoring, change requests with a 2-business-day SLA, and a named analyst on retainer — or scoped hourly help if you just need a fix.
Named analyst2-day SLAFrom $5K/mo