Dax Function: VAR.S
 Reviewed by Neetu Singla — Founder, Lets Viz Technologies — AI & Data Consultant. Last reviewed June 5, 2026.
Category: Statistical Functions
The VAR.S function in Power BI is a DAX statistical function used to calculate the sample variance of a set of numbers. Variance measures the spread or dispersion of data points from the mean. The VAR.S function uses the sample variance formula, which is appropriate when analyzing a subset (sample) of the entire population.
Purpose
The VAR.S function is used to:
Assess data variability in a dataset.
Determine how much the data points deviate from the mean.
Support statistical analysis for sampled datasets.
Type of Calculations
Sample Variance: Calculates the average of the squared deviations from the sample mean.
It assumes the input represents a sample, not the entire population.
Practical Use Cases
Statistical Analysis: Understand the variability within a dataset.
Quality Control: Assess consistency in manufacturing or service processes.
Risk Assessment: Measure volatility in financial data.
Survey Data: Analyze the spread of responses.
VAR.S(<column>)</column>
| Parameter | Type | Description |
|---|---|---|
<Column> | Column | A column containing numeric values for which the sample variance is calculated. |
How Does VAR.S Dax Works
The VAR.S function uses the sample variance formula:
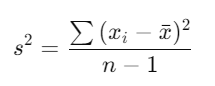
Where:
xi = Each data point.
x̄ = Mean of the sample.
n = Number of data points in the sample.
Calculate the mean (x̄).
Compute the squared deviations of each data point from the mean.
Sum the squared deviations.
Divide the sum by n − 1, where nn is the sample size.
This approach corrects for bias in estimating population variance from a sample.
What Does It Return?
Type: Decimal number.
Meaning: The function returns the sample variance of the specified column. A higher value indicates greater variability.
When Should We Use It?
Sample Analysis: Use when working with a subset of a larger dataset.
Comparing Variability: Compare variances across groups or categories.
Modeling and Forecasting: Input variance values into predictive models.
Examples
Basic Usage :
VAR.S(Sales[Revenue])
Result: Returns the sample variance of the Revenue column in the Sales table.
Column-Based Usage
VAR.S(Orders[Quantity])
Result: Calculates the sample variance of the Quantity column in the Orders table.
Advanced Usage
CALCULATE(
VAR.S(Sales[Profit]),
FILTER(Sales, Sales[Region] = "North")
)
Result: Calculates the sample variance of the Profit column for rows where Region equals “North”.
Tips and Tricks
Ensure Numeric Data: Input column should only contain numeric values. Filter out non-numeric or null values to avoid errors.
Distinguish Between VAR.S and VAR.P: Use VAR.P for population variance and VAR.S for sample variance.
Combine with Other Functions: Pair with AVERAGE or STDEV.S to gain deeper insights into your data.
Common Pitfalls
Applying VAR.S to categorical or non-numeric data will result in errors.
Misinterpreting variance values: High variance indicates more spread; low variance indicates less spread.
Performance Impact of VAR.S DAX Function:
Efficient for small to medium datasets.
For large datasets, pre-aggregate values or optimize calculations to improve performance.
Related Functions You Might Need
Want to Learn More?
For more information, check out the official Microsoft documentation for VAR.S You can also experiment with this function in your Power BI reports to explore its capabilities.
Tap into the full power of Power BI and turn your data into valuable insights with the help of our professional consulting services. Whether you require support with intricate DAX expressions, designing engaging dashboards, or enhancing data models for improved efficiency, our knowledgeable Power BI consultants provide solutions customized to your business needs. Explore our Power BI Consulting Services page to see how we can help your organization make strategic, data-driven choices.
The VAR.S function calculates the sample variance of a numeric column to assess the data’s spread or dispersion.
VAR.S computes variance for a sample, dividing by n−1n – 1. VAR.P calculates population variance, dividing by nn.
No, null or non-numeric values need to be filtered out before using VAR.S.
High variance indicates that the data points are widely spread from the mean.
Yes, VAR.S is suitable for small datasets as it adjusts for bias in sample variance estimation.
Need Power BI help in a real engagement?
Our team writes DAX like this every day for SaaS finance and ops teams. Refresh monitoring, change requests with a 2-business-day SLA, and a named analyst on retainer — or scoped hourly help if you just need a fix.
Named analyst2-day SLAFrom $5K/mo
