Dax Function: NORM.INV
 Reviewed by Neetu Singla — Founder, Lets Viz Technologies — AI & Data Consultant. Last reviewed June 5, 2026.
Category: Statistical Functions
The NORM.INV function in Power BI is a DAX (Data Analysis Expressions) function used to calculate the inverse of the normal cumulative distribution function (CDF) for a given probability. It helps determine the data point (or value) corresponding to a specified cumulative probability, given a normal distribution’s mean and standard deviation.
Purpose of the Function
To find the value x in a normal distribution where the cumulative probability up to x equals a given probability.
Type of Calculations
Reverse lookup in a normal distribution.
Practical Use Cases
- Predict thresholds for specific probabilities in risk analysis.
- Identify percentile-based values in datasets.
- Perform statistical simulations or hypothesis testing.
NORM.INV(<probability>, <mean>, <standard_deviation>)</standard_deviation></mean></probability>
| Parameter | Type | Description |
|---|---|---|
<Probability> | Scalar | The cumulative probability for which you want to find the corresponding value. Must be between 0 and 1. |
<Mean> | Scalar | The mean (average) of the normal distribution. |
<Standard_deviation> | Scalar | The standard deviation of the normal distribution. Must be a positive number. |
How Does NORM.INV Dax Works
The NORM.INV function reverses the cumulative distribution process:
Given a probability P, it finds the value x such that:
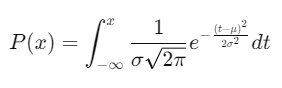
Where:
μ: Mean of the distribution.
σ: Standard deviation of the distribution.
Internally, the function uses numerical approximation techniques to compute x.
What Does It Return?
The NORM.INV function returns:
A numeric value that corresponds to the data point x where the cumulative probability matches the input probability.
If invalid parameters are provided, it may return an error or blank.
When Should We Use It?
Percentile Calculations: Determine the value corresponding to specific percentiles (e.g., 90th percentile).
Threshold Analysis: Establish thresholds for probabilities in quality control or risk management.
Hypothesis Testing: Simulate critical values for normal distributions.
Examples
Basic Usage :
Find the value corresponding to the 90th percentile in a normal distribution with a mean of 50 and a standard deviation of 10:
NORM.INV(0.9, 50, 10)
Output: Approximately 62.82 (the value at the 90th percentile).
Column Usage
Calculate threshold values for cumulative probabilities in a dataset:
ADDCOLUMNS(
Sales,
"ThresholdValue",
NORM.INV(Sales[Probability], 100, 15)
)
Use Case: Append a calculated column that identifies the value thresholds for each probability.
Advanced Usage
Combine with filtering to determine probabilities for specific groups:
CALCULATE(
NORM.INV(0.95, Sales[AverageSales], Sales[SalesStdDev]),
Sales[Category] = "Electronics"
)
Use Case: Find the 95th percentile value of sales in the “Electronics” category.
Tips and Tricks
Probability Constraints: Ensure the probability is between 0 and 1 to avoid errors.
Distribution Assumptions: Verify that the data approximates a normal distribution for accurate results.
Dynamic Inputs: Use calculated measures for mean and standard deviation to adapt to changing datasets.
Performance Impact of NORM.INV DAX Function:
Computational Overhead: While efficient, repeated calls to
NORM.INVwith large datasets may affect performance.Preprocessing: Pre-calculate means and standard deviations where possible for better efficiency.
Related Functions You Might Need
NORM.DIST: Computes the cumulative or probability density for a value in a normal distribution.
PERCENTILEX.INC: Calculates the kk-th percentile of a dataset.
STDEV.P/STDEV.S: Measures the standard deviation of a dataset.
Want to Learn More?
For more information, check out the official Microsoft documentation for NORM.INV You can also experiment with this function in your Power BI reports to explore its capabilities.
Unlock the full capabilities of Power BI and elevate your data insights with our specialized consulting services. Whether you need guidance on advanced DAX functions like those highlighted here, support in designing interactive dashboards, or expertise in optimizing data models for enhanced performance, our experienced Power BI consultants are equipped to deliver customized solutions for your business. Explore our Power BI Consulting Services page to discover how we can help your organization make smarter, data-driven decisions.
It calculates the value xx in a normal distribution corresponding to a given cumulative probability.
The function returns an error since probability values must be within this range.
Yes, you can use measures or calculated columns for dynamic inputs.
NORM.INV finds a value for a given probability, while NORM.DIST calculates the probability or density for a given value.
No, it is specifically designed for normal distributions.
Need Power BI help in a real engagement?
Our team writes DAX like this every day for SaaS finance and ops teams. Refresh monitoring, change requests with a 2-business-day SLA, and a named analyst on retainer — or scoped hourly help if you just need a fix.
Named analyst2-day SLAFrom $5K/mo
