Unlock the Power of Your Data with Our Looker Studio Dashboards
Looker Studio helps you unlock the full potential of your data with interactive dashboards that are both powerful and easy to use. Whether you’re analyzing trends, tracking performance, or sharing insights with your team, Looker Studio provides the tools you need to turn data into actionable insights. Our dashboards are designed to be intuitive and customizable, making it easy for you to explore your data in real-time and make informed decisions with confidence.
Trusted by teams across 15+ countries
Power of Let's Viz Looker Studio Dashboards
Improved Collaboration
Informed Strategic Planning
Scalability and Flexibility
Real-Time Data Access
Data-Driven Decision Making
Customized Insights

How can our Looker dashboards enhance your business performance?
Real-Time Data Access
Looker dashboards provide real-time access to your business data, enabling you to monitor key metrics as they happen. This immediate visibility allows you to react quickly to emerging trends, issues, or opportunities, ensuring that your business remains agile and responsive to changes in the market.
Data-Driven Decision Making
By presenting complex data in an easy-to-understand format, Looker dashboards empower your team to make informed, data-driven decisions. With access to accurate and up-to-date information, your business can reduce guesswork and base strategic decisions on concrete evidence, leading to better outcomes and reduced risks.
Customized Insights
Looker dashboards can be customized to display the most relevant data for your business, whether it’s sales performance, customer behavior, or operational efficiency. This personalization ensures that you’re always focused on the metrics that matter most, helping you to prioritize resources and efforts where they’ll have the greatest impact.
Improved Collaboration
Looker dashboards facilitate better collaboration across your organization by providing a centralized platform where teams can access, analyze, and share data. By having a single source of truth, teams can work together more effectively, align on objectives, and make unified decisions that drive business performance.
Informed Strategic Planning
Looker dashboards provide the insights needed to develop effective strategic plans. By analyzing data from various sources, you can identify market trends, customer preferences, and competitive dynamics. This comprehensive understanding allows you to formulate strategies that are grounded in data, increasing the likelihood of success.
Scalability and Flexibility
Looker dashboards are scalable and can grow with your business. Whether you’re a small startup or a large enterprise, Looker’s flexible platform allows you to adjust your data analysis needs as your business evolves. This adaptability ensures that your dashboards remain relevant and useful as your business expands.
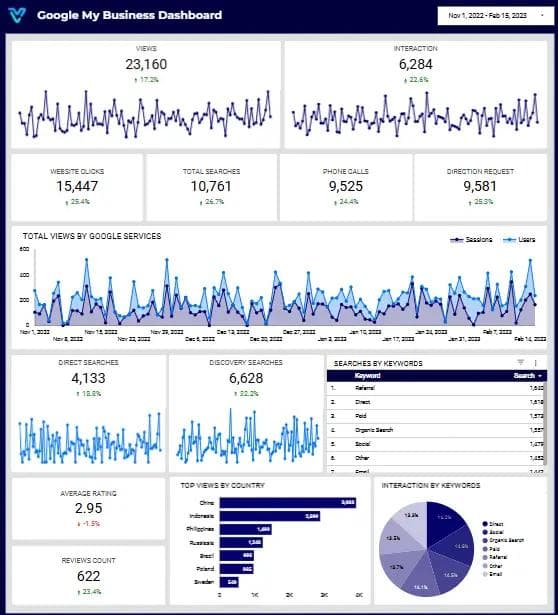
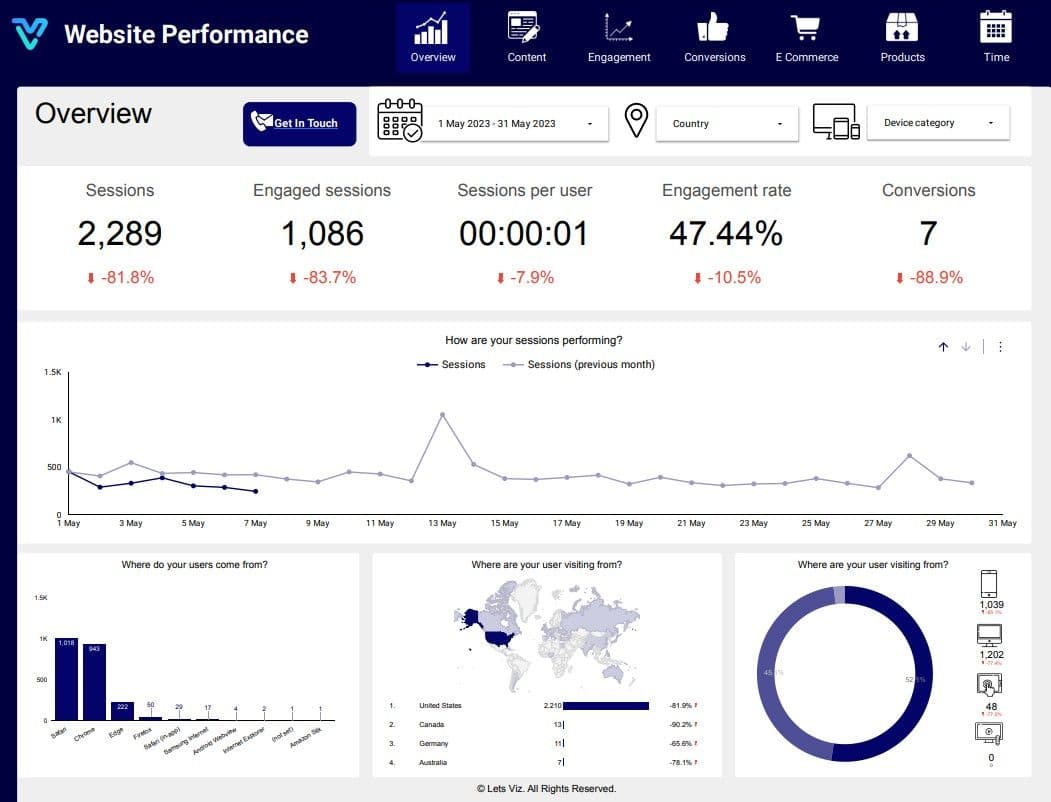
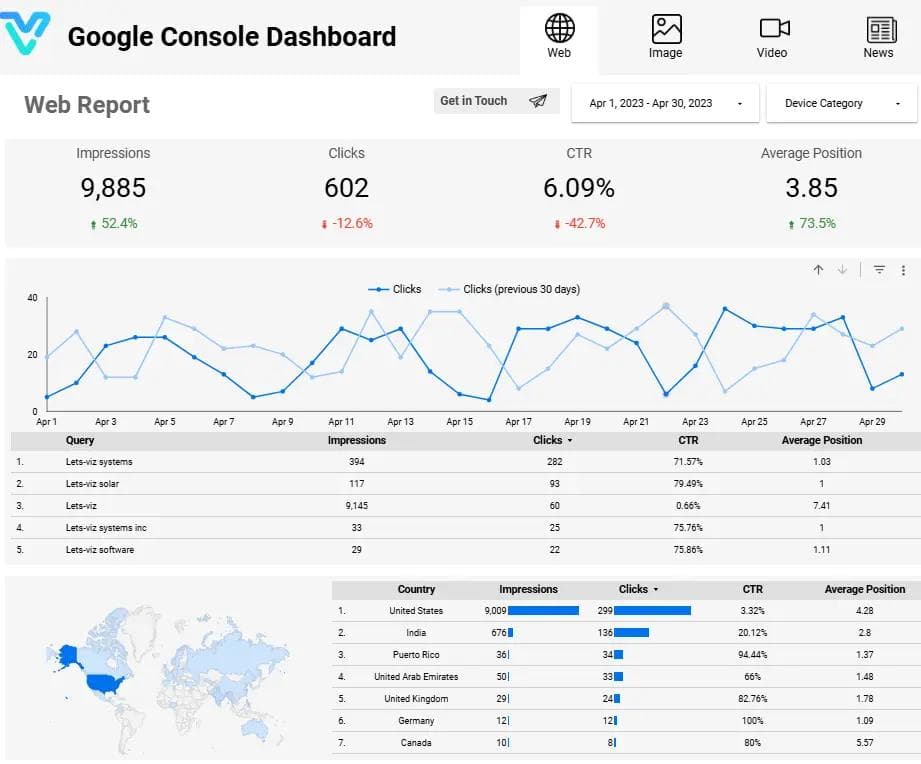
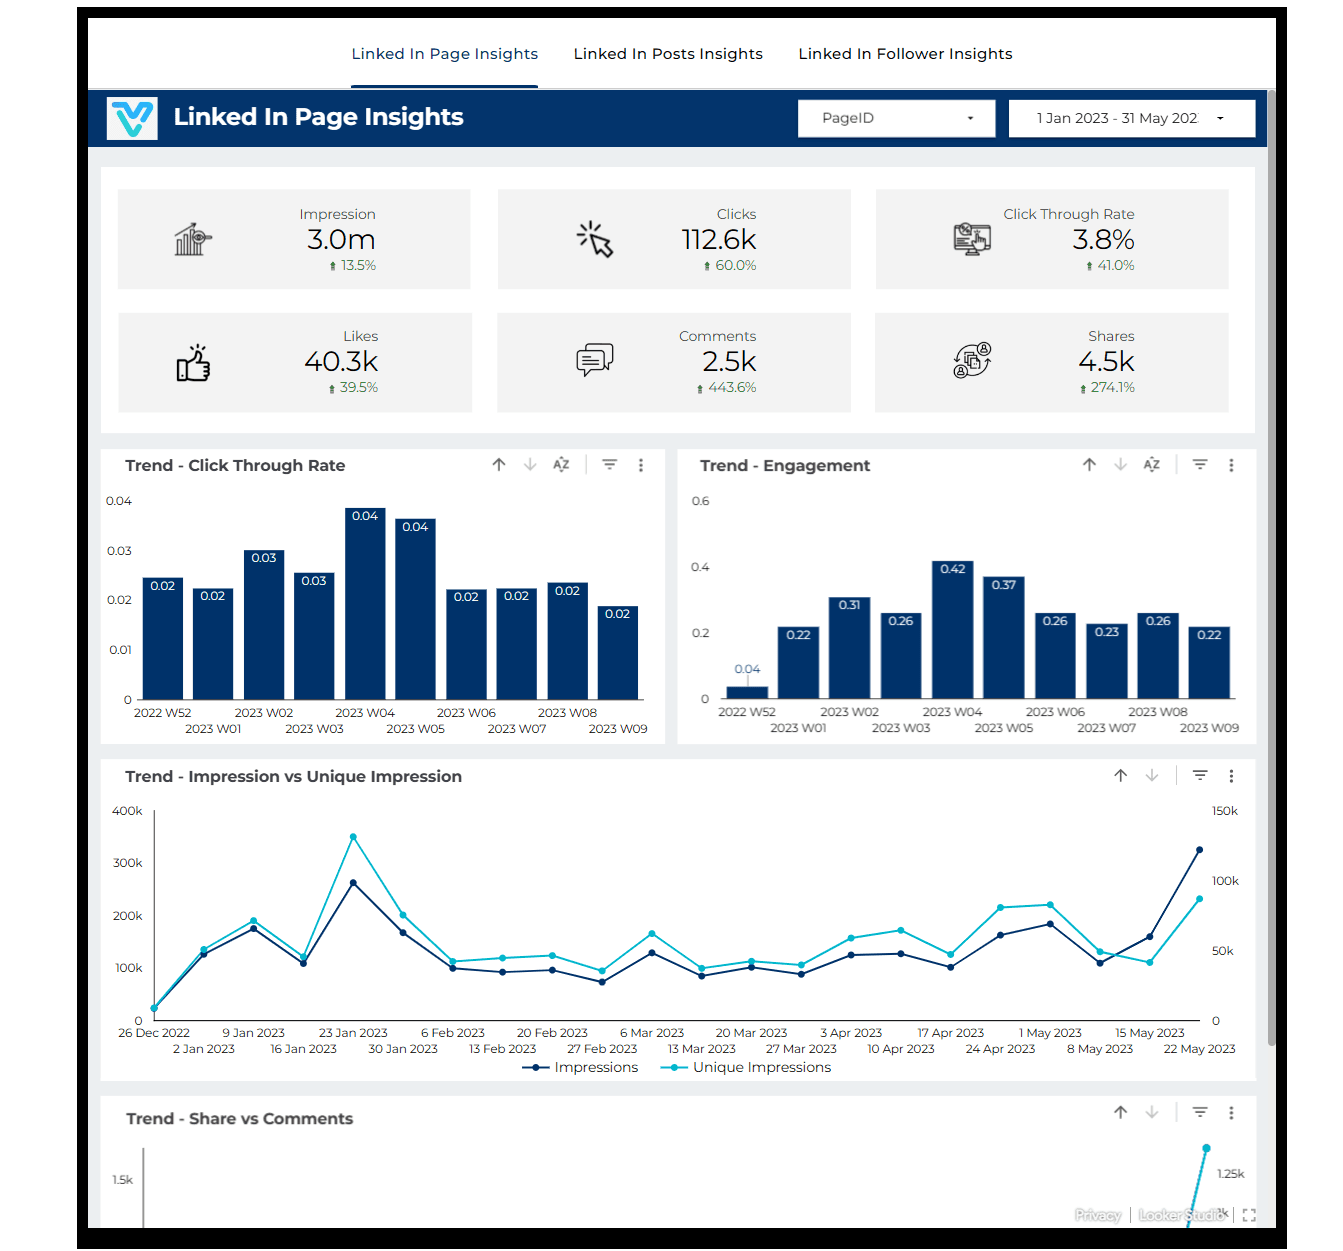
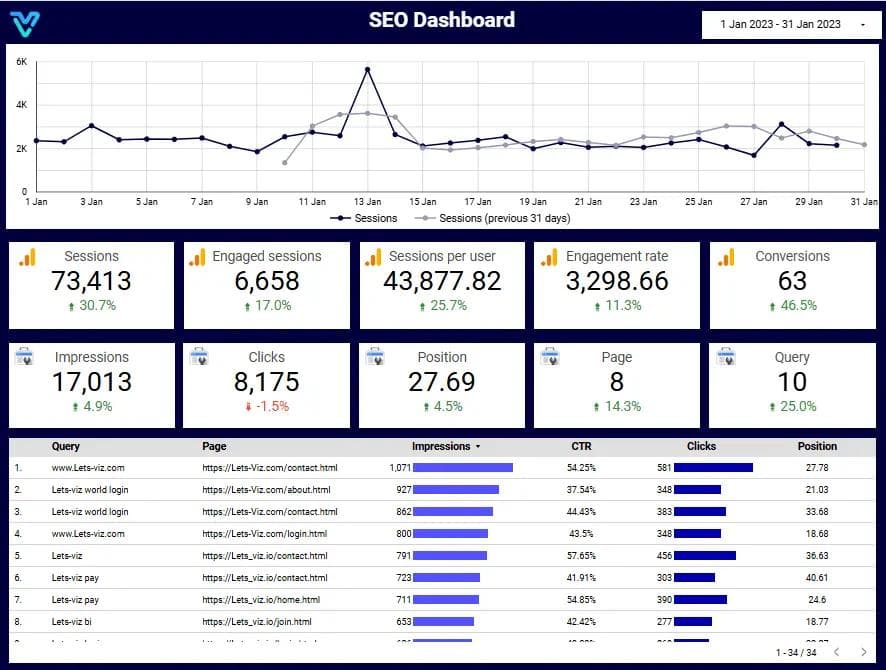
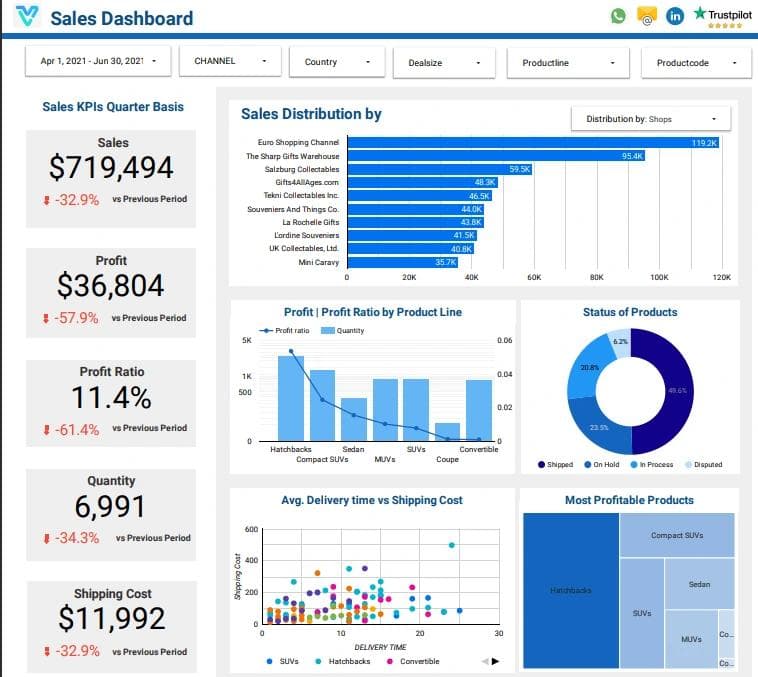
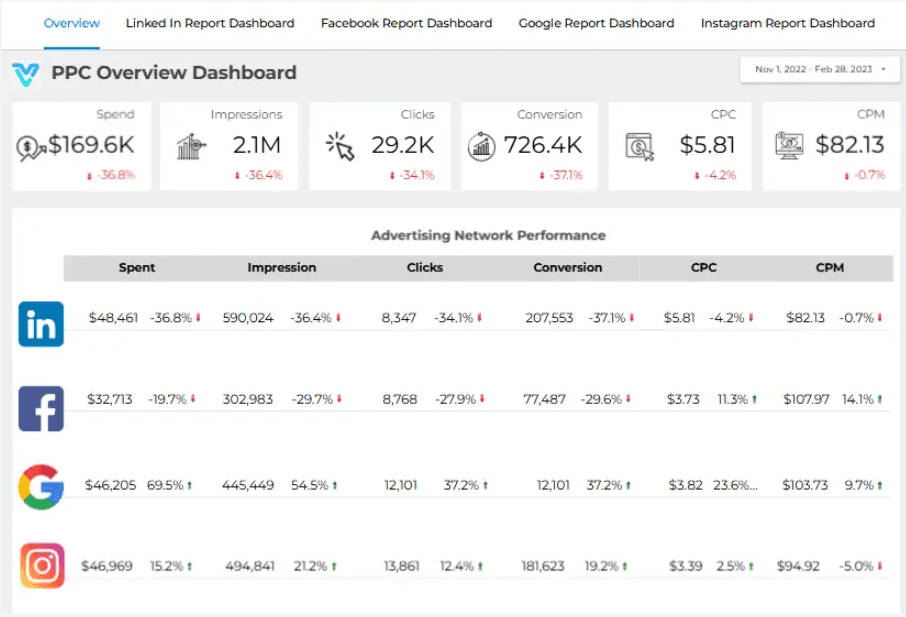
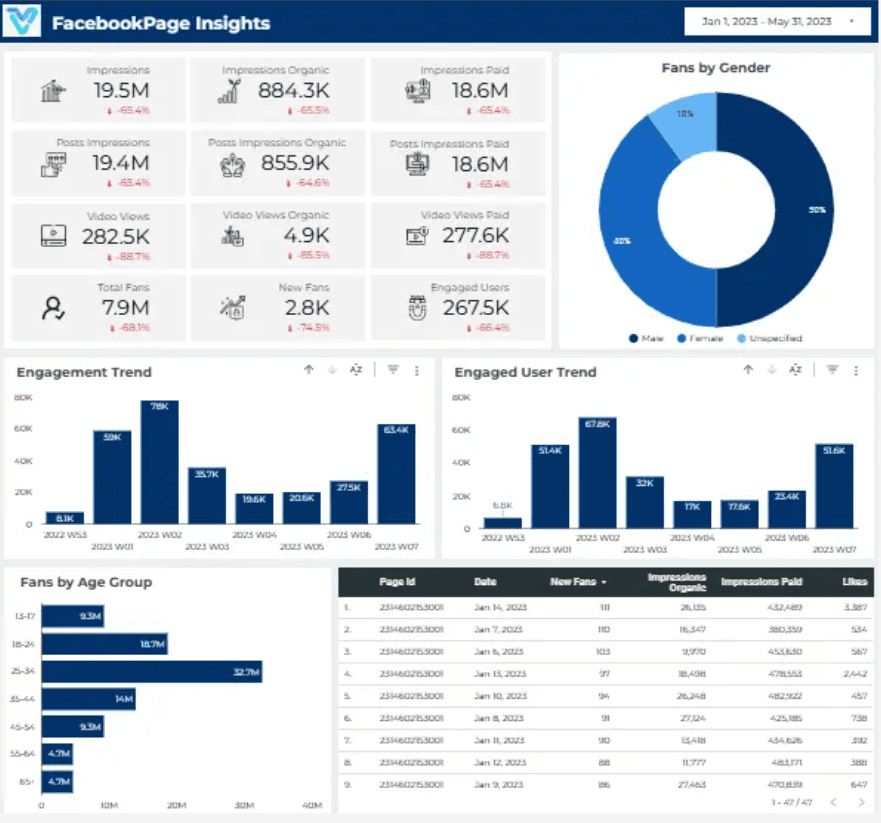
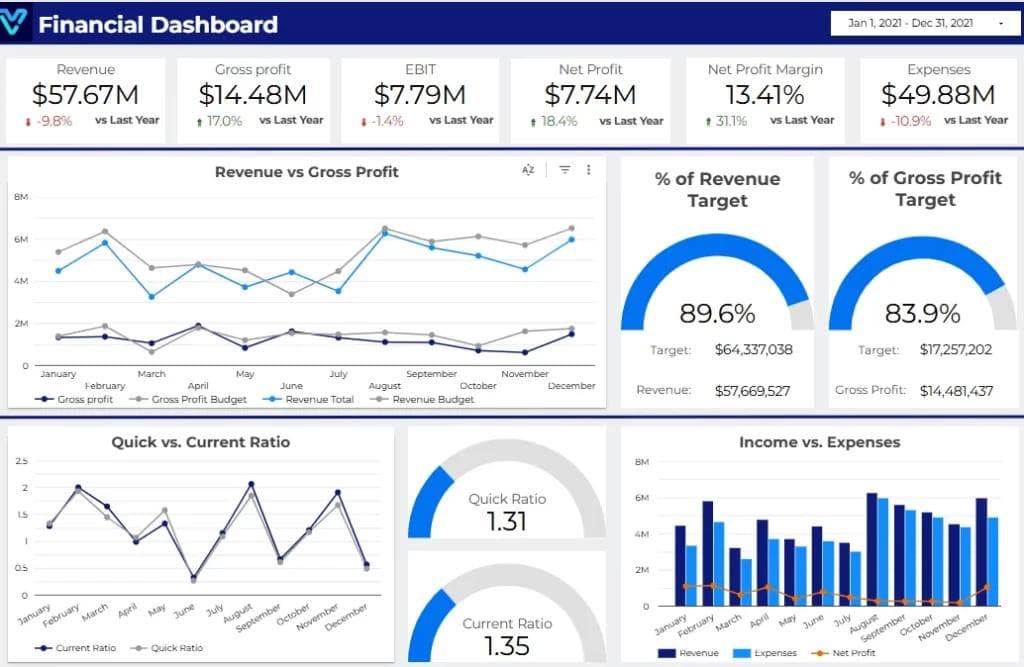
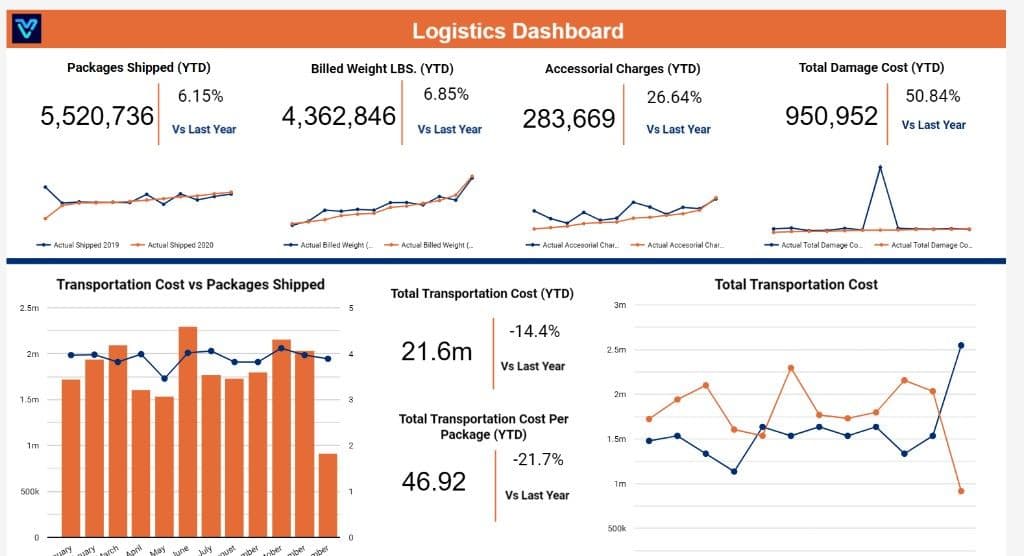
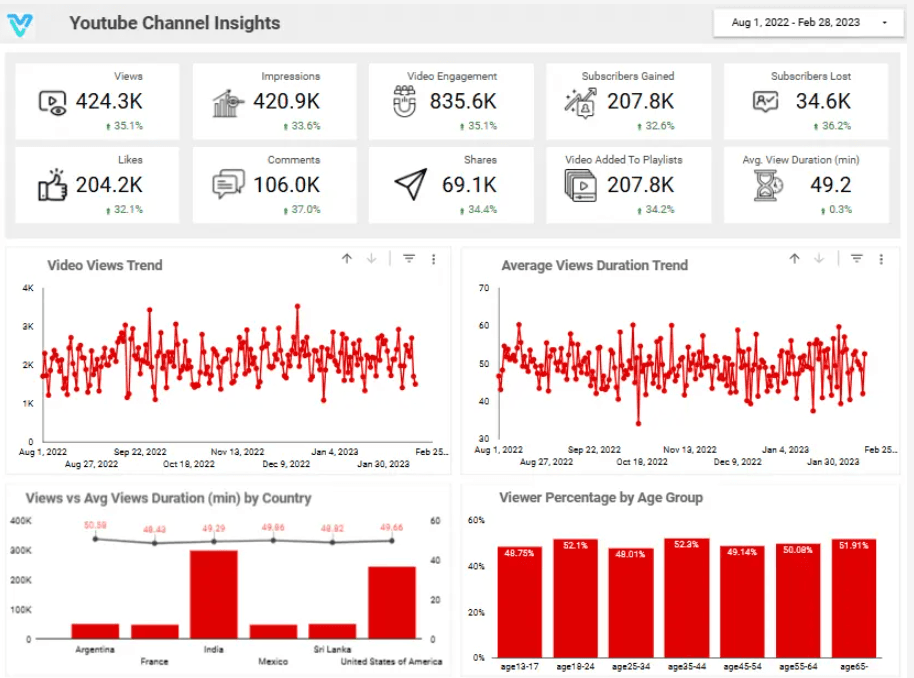
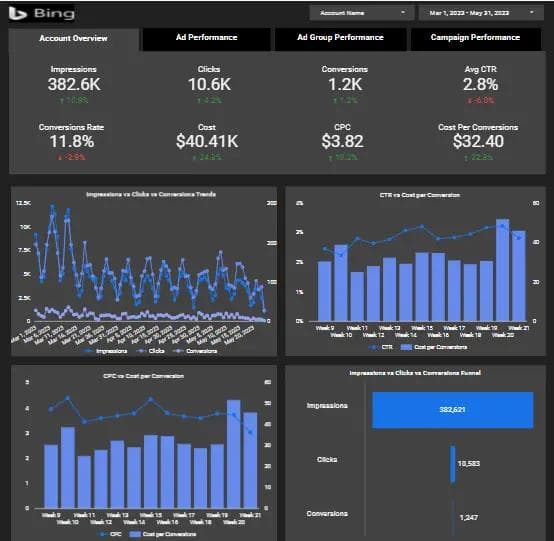
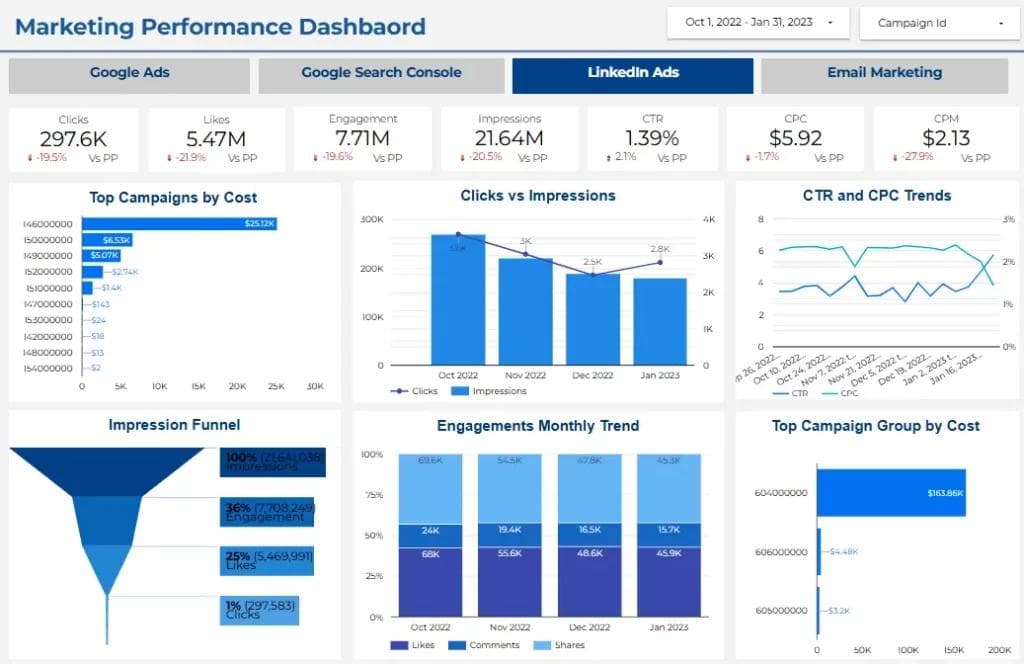
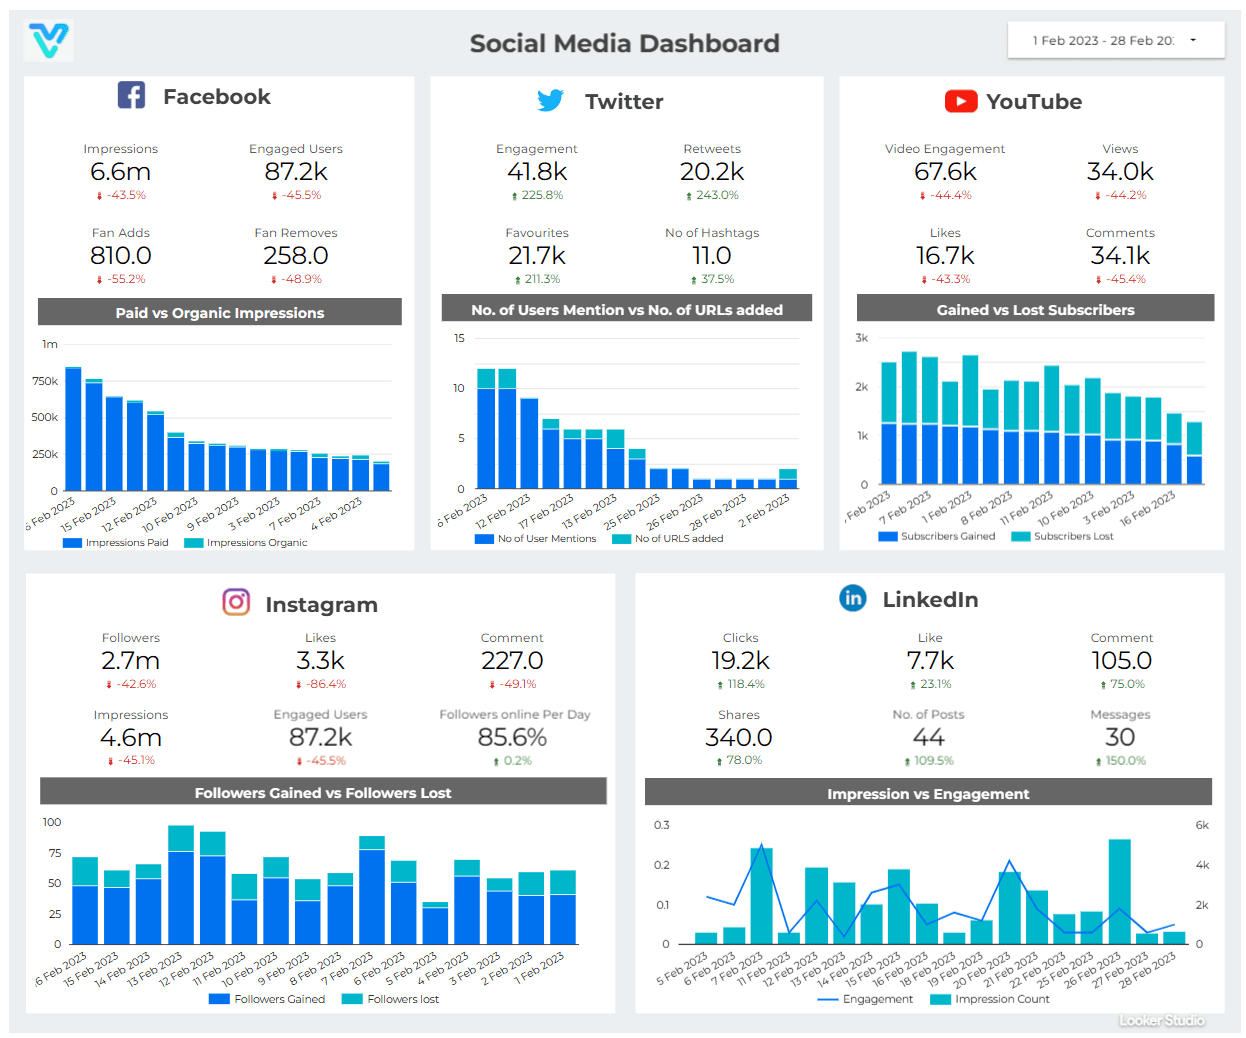
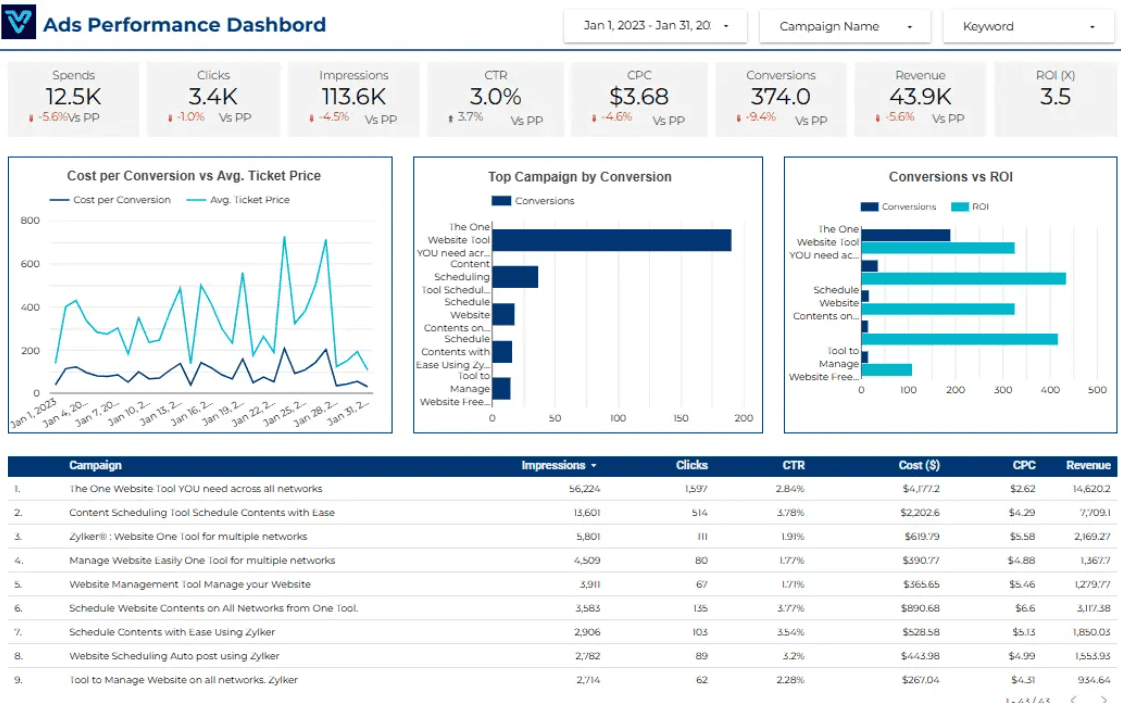
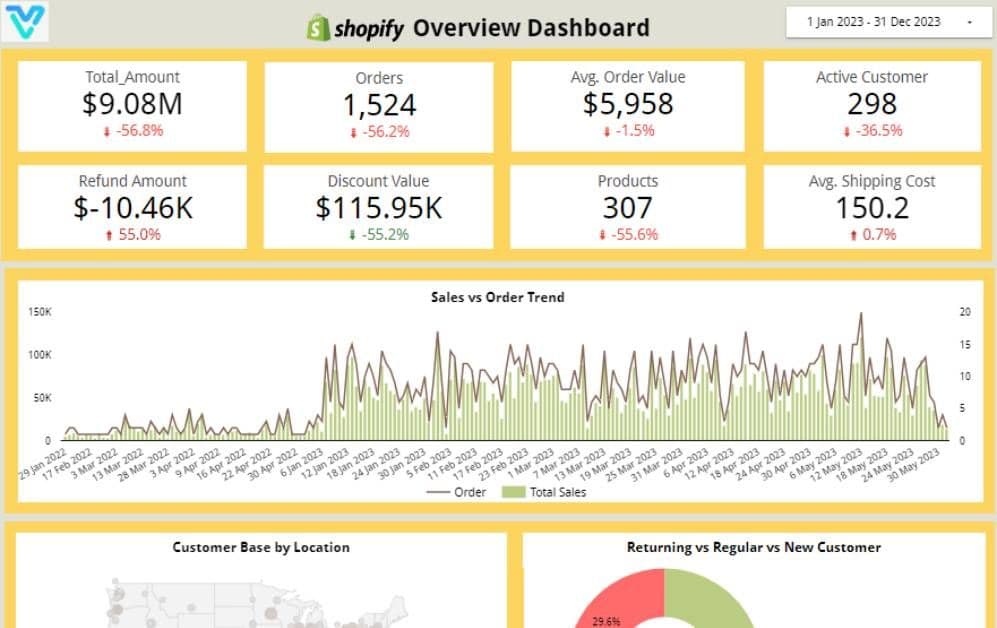
Checkout Our Insightful Looker Dashboard Examples
Explore dashboard examples by department, industry, and tool — then request a similar build.
Elevate Your Business Intelligence with Stunning KPI's
Revenue Growth Rate
Track the percentage increase in your company’s revenue over time. This KPI helps you measure business growth, identify trends, and assess the effectiveness of sales strategies.
Operating Cash Flow
Analyze the cash generated from your core business operations. This KPI indicates the financial stability of your business and its ability to generate positive cash flow
Customer Lifetime Value (CLV)
Evaluate the total revenue a business can expect from a single customer account. Comparing CLTV with CAC helps you determine the long-term profitability of customer relationships.
Cost Per Lead (CPL)
Track the cost of generating new leads through marketing efforts. This KPI helps you assess the efficiency of your lead generation strategies and optimize marketing spend.
Social Media Engagement
Monitor the level of interaction with your brand on social media platforms. High engagement indicates strong brand presence and customer connection
Churn Rate
Track the rate at which customers stop doing business with your company. A lower churn rate indicates higher customer retention and satisfaction, directly impacting long-term growth.
Average Order Value (AOV)
Track the average amount spent each time a customer places an order. Increasing AOV can significantly boost revenue without needing to acquire new customers
Customer Acquisition Cost (CAC)
Monitor the cost of acquiring a new customer by analyzing marketing expenses and the number of customers gained. This KPI is crucial for understanding the efficiency of your marketing efforts.
Customer Lifetime Value (CLV)
Calculate the total revenue generated by a customer throughout their relationship with your business. CLV helps prioritize customer segments, tailor marketing strategies, and enhance customer retention efforts.
Customer Retention Rate
Measure the percentage of customers who continue to do business with you over time. High retention rates are indicative of customer loyalty and satisfaction.
Wondering what this would cost you?
Answer a few questions and see an honest price range on screen — no email, no call needed.
Frequently Asked Questions
Find answers to common questions about our services and process.

Helping thousands of data-driven companies to achieve their target Goals
Daily we publish thousands of Creative dashboards, process billions of rows, store terabytes of data for companies just like yours.