Dax Function: VAR.P
 Reviewed by Neetu Singla — Founder, Lets Viz Technologies — AI & Data Consultant. Last reviewed June 5, 2026.
Category: Statistical Functions
The VAR.P function in Power BI is a DAX statistical function used to calculate the population variance of a dataset. Population variance measures the dispersion of all data points in a dataset relative to the mean. Unlike VAR.S, which deals with sample data, VAR.P assumes the data represents the entire population.
Purpose
The VAR.P function is utilized to:
Assess the spread or variability of the entire dataset.
Support analytical scenarios where population data is available.
Complement other statistical metrics such as standard deviation or mean.
Type of Calculations
Population Variance: Measures the average of the squared deviations of all data points from the mean.
It provides an exact measure of variability within a complete dataset.
Practical Use Cases
Financial Analysis: Measure the volatility of returns or investments across all available data points.
Performance Metrics: Analyze consistency in processes where the entire population of data is available.
Risk Management: Assess the risk of an entire portfolio or dataset.
Data Science Models: Provide variance inputs for predictive models and simulations.
VAR.P(<column>)</column>
| Parameter | Type | Description |
|---|---|---|
<Column> | Column | A column containing numeric values for which the population variance is calculated. |
How Does VAR.P Dax Works
The VAR.P function uses the population variance formula:
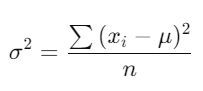
Where:
xi = Each data point.
μ = Mean of the population.
n = Number of data points in the population.
Calculate the mean (μ).
Compute the squared deviations of each data point from the mean.
Sum the squared deviations.
Divide the sum by n, the total number of data points.
This approach ensures precise measurement for complete datasets.
What Does It Return?
Type: Decimal number.
Meaning: The function returns the variance of the specified column, representing the spread of all data points in the population.
When Should We Use It?
Full Dataset Analysis: Use when you have the entire population of data, not just a sample.
Variance Inputs for Models: Provide exact variance for machine learning or simulation models.
Comparative Analysis: Compare variances between multiple populations.
Examples
Basic Usage :
VAR.P(Sales[Revenue])
Result: Returns the population variance of the Revenue column in the Sales table.
Column-Based Usage
VAR.P(Products[Cost])
Result: Calculates the population variance of the Cost column in the Products table.
Advanced Usage
CALCULATE(
VAR.P(Sales[Profit]),
FILTER(Sales, Sales[Category] = "Electronics")
)
Result: Calculates the population variance of the Profit column for rows where Category equals “Electronics”.
Tips and Tricks
Verify Population Data: Ensure the data represents the entire population before using VAR.P.
Distinguish Between VAR.P and VAR.S: Use VAR.P for population variance; use VAR.S for sample variance.
Pair with Related Metrics: Combine with STDEV.P to gain additional insights into dataset variability.
Common Pitfalls
Applying VAR.P to non-numeric or categorical data will result in errors.
Using VAR.P for sample data can lead to underestimation of variance.
Performance Impact of VAR.P DAX Function:
Efficient for medium to large datasets when optimized.
For very large datasets, consider pre-aggregating data to enhance performance.
Related Functions You Might Need
Want to Learn More?
For more information, check out the official Microsoft documentation for VAR.P You can also experiment with this function in your Power BI reports to explore its capabilities.
Harness the complete potential of Power BI and transform your data into meaningful insights with our expert consulting services. Whether you’re seeking assistance with complex DAX formulas, need help crafting interactive dashboards, or want to fine-tune your data models for better efficiency, our skilled Power BI consultants offer tailored solutions to meet your business objectives. Visit our Power BI Consulting Services page to learn how we can empower your organization to make informed, data-centric decisions.
The VAR.P function calculates the population variance of a numeric column, measuring the data’s spread across the entire population.
VAR.P calculates population variance, dividing by n, while VAR.S calculates sample variance, dividing by n − 1.
No, null values should be excluded or filtered out before using VAR.P.
A low variance indicates that data points are close to the mean and have less spread.
No, use VAR.S for sample data to avoid underestimating the variance.
Need Power BI help in a real engagement?
Our team writes DAX like this every day for SaaS finance and ops teams. Refresh monitoring, change requests with a 2-business-day SLA, and a named analyst on retainer — or scoped hourly help if you just need a fix.
Named analyst2-day SLAFrom $5K/mo
