Dax Function: CONFIDENCE.T
 Reviewed by Neetu Singla — Founder, Lets Viz Technologies — AI & Data Consultant. Last reviewed June 5, 2026.
Category: Statistical Functions
The CONFIDENCE.T function calculates the confidence interval for a population mean using a Student’s t-distribution. This is particularly useful for smaller sample sizes or when the population standard deviation is unknown.
Purpose of the Function
To estimate the range of values within which the population mean is likely to fall, based on a given confidence level and sample data.
Type of Calculations
Inferential statistics with a focus on small sample sizes or unknown population standard deviation.
Practical Use Cases
- Situations where the population standard deviation is not available.
- Analyzing experimental data with small datasets.
- Statistical quality control and precision measurement.
CONFIDENCE.T(alpha, standard_dev, size)
| Parameter | Type | Description |
|---|---|---|
alpha | Scalar | The significance level (1 – confidence level). Must be between 0 and 1. |
standard_dev | Scalar | The standard deviation of the sample. Must be a positive number. |
size | Scalar | The sample size. Must be a positive integer greater than 1. |
How Does CONFIDENCE.T Dax Works
The formula for the confidence interval using a t-distribution is:
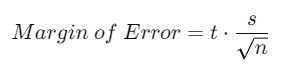
Where:
t: The critical value (t-score) from the Student’s t-distribution for the given confidence level and degrees of freedom (n−1n-1).
s: The sample standard deviation (
standard_dev).n: The sample size (
size).
Mathematical Principles
The t-distribution accounts for additional variability due to small sample sizes.
It approaches the standard normal distribution as the sample size increases.
Example Calculation
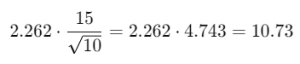
For a 95% confidence level (α = 0.05), with a sample standard deviation of 15 and a sample size of 10:
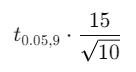
Assuming t0.05,9 = 2.262, the margin of error is:
What Does It Return?
The function returns a numeric value representing the margin of error for the population mean based on the specified confidence level and sample data. This value can be added to and subtracted from the sample mean to calculate the confidence interval.
When Should We Use It?
For small sample sizes (n < 30).
When the population standard deviation is unknown, and only sample data is available.
In hypothesis testing and confidence interval estimation for small datasets.
Examples
Basic Usage :
Calculate the margin of error for a 90% confidence level, sample standard deviation of 8, and sample size of 20:
CONFIDENCE.T(0.10, 8, 20)
Output: 3.692
Column Usage
Apply the function to a column of sample sizes and standard deviations:
CONFIDENCE.T(0.05, Table[StandardDeviation], Table[SampleSize])
This dynamically calculates the margin of error for each row.
Advanced Usage
Combine CONFIDENCE.T with other DAX functions to create dynamic confidence intervals:
VAR MarginError = CONFIDENCE.T(0.05, [StandardDeviation], [SampleSize])
RETURN [SampleMean] + MarginError
This computes the upper bound of the confidence interval.
Tips and Tricks
Small Samples: Use
CONFIDENCE.Tfor small datasets; for larger datasets,CONFIDENCE.NORMmay suffice.Alpha Interpretation: Ensure the
alphavalue correctly reflects the confidence level (1−alpha1 – \text{alpha}).Degrees of Freedom: Understand the impact of degrees of freedom (n−1n-1) on the t-score.
Potential Pitfalls
Invalid Inputs: Ensure
alphais between 0 and 1,standard_devis positive, andsizeis greater than 1.Overfitting: For very small sample sizes, results might not generalize well.
Performance Impact of CONFIDENCE.T DAX Function:
Dynamic Calculations: Pre-compute the sample standard deviation and mean for large datasets.
Optimized Usage: Apply to aggregated data for better performance on complex models.
Related Functions You Might Need
CONFIDENCE.NORM: For larger sample sizes or known population standard deviation.
AVERAGE: To calculate the sample mean.
STDEV.S: To calculate the sample standard deviation.
Want to Learn More?
For more information, check out the official Microsoft documentation for CONFIDENCE.T You can also experiment with this function in your Power BI reports to explore its capabilities.
Unlock the full capabilities of Power BI and elevate your data insights with our specialized consulting services. Whether you need guidance on advanced DAX functions like those highlighted here, support in designing interactive dashboards, or expertise in optimizing data models for enhanced performance, our experienced Power BI consultants are equipped to deliver customized solutions for your business. Explore our Power BI Consulting Services page to discover how we can help your organization make smarter, data-driven decisions.
It calculates the margin of error for a population mean using a t-distribution.
Use CONFIDENCE.T when the sample size is small or the population standard deviation is unknown.
No, standard_dev must be positive, and size must be greater than 1.
The results may be unreliable due to high variability. Consider collecting more data.
A smaller alpha (e.g., 0.01) results in a wider confidence interval, indicating greater confidence.
Need Power BI help in a real engagement?
Our team writes DAX like this every day for SaaS finance and ops teams. Refresh monitoring, change requests with a 2-business-day SLA, and a named analyst on retainer — or scoped hourly help if you just need a fix.
Named analyst2-day SLAFrom $5K/mo
