Dax Function: T.DIST
 Reviewed by Neetu Singla — Founder, Lets Viz Technologies — AI & Data Consultant. Last reviewed June 5, 2026.
Category: Statistical Functions
The T.DIST function in Power BI is a DAX (Data Analysis Expressions) statistical function that calculates the probability density or cumulative distribution for the t-distribution. The t-distribution is commonly used in hypothesis testing and confidence interval estimation when sample sizes are small, or the population standard deviation is unknown.
Purpose
The T.DIST function evaluates the likelihood of observing a t-value in a t-distribution given a specified degree of freedom and whether the cumulative or probability density form is required. It is instrumental in statistical analyses, particularly in inferential statistics.
Type of Calculations
Probability Density Function (PDF): Returns the height of the distribution curve for a given t-value.
Cumulative Distribution Function (CDF): Returns the probability that a t-value is less than or equal to the input value.
Practical Use Cases
Hypothesis Testing: Assess the p-value for a t-test in small sample datasets.
Confidence Intervals: Calculate the probability associated with a specific range of t-values.
Data Validation: Use in statistical models to validate assumptions about data distribution.
T.DIST(<x>, <deg_freedom>, <cumulative>)</cumulative></deg_freedom></x>
| Parameter | Type | Description |
|---|---|---|
X | Scalar | The t-value for which the distribution is calculated. |
Deg_freedom | Scalar | The degrees of freedom, typically n−1n – 1, where nn is the sample size. Must be ≥ 1. |
Cumulative | Boolean | Determines the type of distribution: TRUE for cumulative distribution, FALSE for probability density. |
How Does T.DIST Dax Works
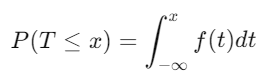
The T.DIST function is based on the t-distribution formula:
Cumulative Distribution Function (CDF):
Probability Density Function (PDF):
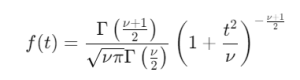
Where:
t = t-value.
ν = degrees of freedom.
Γ = gamma function.
The function computes the desired probability based on the Cumulative parameter.
What Does It Return?
Type: Decimal number.
Meaning: Returns the calculated probability as a decimal, either as a cumulative distribution or probability density.
When Should We Use It?
Small Sample Sizes: Useful for t-tests or confidence intervals when n<30n < 30.
Hypothesis Testing: To determine the significance of observed t-values.
Data Distribution Analysis: When verifying assumptions about a dataset’s distribution.
Examples
Basic Usage :
T.DIST(1.5, 10, TRUE)
Result: Computes the cumulative probability for a t-value of 1.5 with 10 degrees of freedom.
Probability Density Example
T.DIST(1.5, 10, FALSE)
Result: Calculates the probability density at t-value 1.5 with 10 degrees of freedom.
Advanced Usage with CALCULATE
CALCULATE(T.DIST(SUM(Sales[Profit]) / COUNT(Sales[Profit]), 15, TRUE))
Result: Evaluates the cumulative probability for a t-value derived from profit data with 15 degrees of freedom.
Tips and Tricks
Degrees of Freedom (DoF): Ensure DoF reflects the sample size minus the number of constraints (e.g., n − 1 ).
Select Correct Mode: Use
TRUEfor cumulative distributions in most statistical tests andFALSEfor probability density visualizations.Use with Confidence: Pair with other statistical functions like T.INV for robust analyses.
Potential Pitfalls
Invalid degrees of freedom (e.g., less than 1) result in errors.
Ensure t-values are computed accurately for meaningful results.
Performance Impact of T.DIST DAX Function:
Efficient for small datasets but may require optimizations with FILTER or CALCULATE for complex analyses.
Avoid redundant calculations by pre-computing values when possible.
Related Functions You Might Need
Want to Learn More?
For more information, check out the official Microsoft documentation for T.DIST You can also experiment with this function in your Power BI reports to explore its capabilities.
Unleash the full capabilities of Power BI by converting your data into strategic insights with support from our skilled consulting team. Whether you’re tackling advanced DAX calculations, developing user-friendly dashboards, or refining data models for maximum efficiency, our seasoned Power BI consultants offer personalized solutions aligned with your business objectives. Check out our Power BI Consulting Services page to learn how we can help your organization make smarter, data-driven choices.
It calculates the probability for a t-value in a t-distribution, useful for hypothesis testing and confidence intervals.
Cumulative gives the probability up to a t-value, while probability density provides the curve height at a specific t-value.
The function returns an error as degrees of freedom must be ≥ 1.
While it can, larger sample sizes are better suited for normal distribution functions like NORM.DIST.
T.DIST computes the one-tailed probability, while T.DIST.2T calculates the two-tailed probability.
Need Power BI help in a real engagement?
Our team writes DAX like this every day for SaaS finance and ops teams. Refresh monitoring, change requests with a 2-business-day SLA, and a named analyst on retainer — or scoped hourly help if you just need a fix.
Named analyst2-day SLAFrom $5K/mo
