Dax Function: BETA.DIST
 Reviewed by Neetu Singla — Founder, Lets Viz Technologies — AI & Data Consultant. Last reviewed June 5, 2026.
Category: Statistical Functions
The BETA.DIST function in Power BI is a statistical function that returns the beta distribution for a given set of parameters. It is commonly used in probability and statistics to model the distribution of a variable within a defined range.
Purpose of the Function
Primary Objective: Model probabilities in situations where data has an inherent range (e.g., proportions, percentages).
Type of Calculations: Returns the probability density function (PDF) or the cumulative distribution function (CDF) based on the input values and parameters.
Practical Use Cases
Quality Control: Model defect probabilities in manufacturing processes.
Risk Analysis: Assess probabilities in financial and project management scenarios.
Resource Allocation: Predict outcomes in scenarios with a fixed range (e.g., percentage of budget allocation).
BETA.DIST(x, alpha, beta, cumulative, [lower_bound], [upper_bound])
| Parameter | Type | Description |
|---|---|---|
x | Scalar | The value at which to evaluate the distribution (must lie between the bounds). |
alpha | Scalar | A parameter of the distribution (must be > 0). |
beta | Scalar | A parameter of the distribution (must be > 0). |
cumulative | Boolean | TRUE for the cumulative distribution function (CDF); FALSE for the probability density function (PDF). |
[lower_bound] | Scalar | The lower bound of the interval of x. Defaults to 0 if omitted. |
[upper_bound] | Scalar | The upper bound of the interval of x. Defaults to 1 if omitted. |
How Does BETA.DIST Dax Works
The beta distribution is defined by the formula:
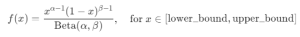
Where:
α and β are shape parameters.
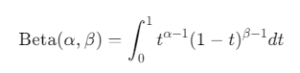
Beta(α, β) is the beta function, calculated as:
PDF: Represents the likelihood of
xwithin the specified range.CDF: Represents the probability that a random variable X takes a value less than or equal to
x.
What Does It Return?
The function returns a numerical value representing either the PDF or CDF of the beta distribution evaluated at the given value of x.
When Should We Use It?
Use
BETA.DISTfor data distributions constrained to a finite range, such as proportions or probabilities.Ideal for scenarios involving uncertainties, such as predicting success rates or customer satisfaction percentages.
Examples
Basic Usage :
Evaluate the PDF of the beta distribution at x = 0.5 with parameters α = 2, β = 3, and the default bounds:
BETA.DIST(0.5, 2, 3, FALSE)
Output: 1.5 (value of the PDF at x=0.5x = 0.5).
Custom Bounds
Evaluate the PDF with custom bounds [1,10][1, 10]:
BETA.DIST(4, 2, 3, FALSE, 1, 10)
Output: The PDF adjusted for the range [1,10][1, 10].
Advanced Usage
Combine BETA.DIST with other DAX functions to create complex models:
SUMX(FILTER(Table, Table[Category] = "A"), BETA.DIST(Table[Value], 2, 5, TRUE))
This calculates the cumulative probability for each value in a filtered table.
Tips and Tricks
Understand Parameters: The alpha and beta values define the shape of the curve. Experiment with different values to see how the distribution changes.
CDF vs. PDF: Use
TRUEfor cumulative probabilities (to find the likelihood of being below a threshold) andFALSEfor specific likelihood values.Bounds Matter: Adjust bounds carefully to reflect the actual range of your data.
Potential Pitfalls
Values of
xmust fall within the bounds. If not, the function returns an error.Alpha and beta must be strictly positive.
Performance Impact of BETA.DIST DAX Function:
Efficient for small datasets but can slow down with large, complex calculations.
Avoid using it on datasets with undefined or missing values for
x,alpha, orbeta.
Related Functions You Might Need
NORM.DIST: For normal distributions.
BINOM.DIST: For binomial distributions.
GAMMA.DIST: For gamma distributions.
Want to Learn More?
For more information, check out the official Microsoft documentation for BETA.DIST You can also experiment with this function in your Power BI reports to explore its capabilities.
Unlock the full capabilities of Power BI and elevate your data insights with our specialized consulting services. Whether you need guidance on advanced DAX functions like those highlighted here, support in designing interactive dashboards, or expertise in optimizing data models for enhanced performance, our experienced Power BI consultants are equipped to deliver customized solutions for your business. Explore our Power BI Consulting Services page to discover how we can help your organization make smarter, data-driven decisions.
To model probabilities and evaluate the beta distribution for given parameters.
CDF gives cumulative probabilities, while PDF provides likelihood values for specific points.
Yes, you can specify custom lower_bound and upper_bound parameters.
Parameters alpha and beta must be positive, and x must lie within the specified bounds.
Risk analysis, resource allocation, and modeling probabilities in constrained ranges.
Need Power BI help in a real engagement?
Our team writes DAX like this every day for SaaS finance and ops teams. Refresh monitoring, change requests with a 2-business-day SLA, and a named analyst on retainer — or scoped hourly help if you just need a fix.
Named analyst2-day SLAFrom $5K/mo
