Dax Function: PERCENTILE.EXC
 Reviewed by Neetu Singla — Founder, Lets Viz Technologies — AI & Data Consultant. Last reviewed June 5, 2026.
Category: Statistical Functions
The PERCENTILE.EXC function in Power BI is a DAX function used to calculate a value at a specified percentile (exclusive) from a given dataset. The function excludes the boundaries (minimum and maximum values) from the percentile calculation, offering more precision in datasets with outliers or extreme values.
Purpose of the Function
To determine the value below which a given percentage of data falls, excluding boundaries.
Type of Calculations
Performs quantile calculations for percentile analysis.
Practical Use Cases
- Analyzing distribution of sales or revenue.
- Segmenting data into percentiles for customer ranking.
- Identifying thresholds for performance evaluation.
PERCENTILE.EXC(<column>, <k>)</k></column>
| Parameter | Type | Description |
|---|---|---|
<Column> | Column | The column of data values for which the percentile is calculated. |
<K> | Scalar | A numeric value between 0 and 1 (exclusive) representing the desired percentile. |
How Does PERCENTILE.EXC Dax Works
Mathematical Principle
The function computes the k-percentile by interpolating between data points in the dataset. For a dataset with nn elements sorted in ascending order:
Calculate the position index:
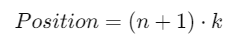
If the position is an integer, return the value at that position.
If the position is not an integer, interpolate between the nearest two data points.
For example:
n = 10, k = 0.3:
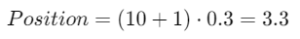
Interpolate between the 3rd and 4th values.
What Does It Return?
The PERCENTILE.EXC function returns:
A scalar value representing the calculated percentile.
The value is derived using interpolation between two values in the dataset, as the function assumes the dataset does not include the specified k-percentile explicitly.
When Should We Use It?
Data Segmentation: Divide data into percentiles for ranking or thresholding.
Excluding Outliers: Analyze percentiles without boundary influence.
Data Summarization: Summarize datasets with percentile thresholds.
Examples
Basic Usage :
Find the 90th percentile (exclusive) of a dataset:
PERCENTILE.EXC(Sales[Amount], 0.9)
Output: Returns the value below which 90% of the data falls, excluding boundaries.
Column Usage
Apply the function to calculate percentiles for each category:
ADDCOLUMNS(
Categories,
"90th Percentile",
PERCENTILE.EXC(SUMMARIZE(Sales, Sales[Category]), 0.9)
)
Use Case: Add a column showing the 90th percentile of sales for each category.
Advanced Usage
Combine with filtering to calculate percentiles for a specific subgroup:
CALCULATE(
PERCENTILE.EXC(Sales[Amount], 0.75),
Sales[Region] = "North"
)
Use Case: Compute the 75th percentile of sales for the “North” region.
Tips and Tricks
Valid Input: Ensure k is strictly between 0 and 1 to avoid errors.
Boundary Handling: Use
PERCENTILE.INCif boundary inclusion is necessary.Large Datasets: Preprocess data or filter subsets for better performance on extensive datasets.
Performance Impact of PERCENTILE.EXC DAX Function:
Works efficiently on moderate datasets.
For large datasets, consider filtering or aggregating data to improve performance.
Related Functions You Might Need
PERCENTILE.INC: Includes boundaries in percentile calculations.
MEDIAN: Calculates the 50th percentile (middle value) directly.
RANKX: Ranks values and can complement percentile analysis.
Want to Learn More?
For more information, check out the official Microsoft documentation for PERCENTILEEXC You can also experiment with this function in your Power BI reports to explore its capabilities.
Unlock the full capabilities of Power BI and elevate your data insights with our specialized consulting services. Whether you need guidance on advanced DAX functions like those highlighted here, support in designing interactive dashboards, or expertise in optimizing data models for enhanced performance, our experienced Power BI consultants are equipped to deliver customized solutions for your business. Explore our Power BI Consulting Services page to discover how we can help your organization make smarter, data-driven decisions.
It calculates the value at a specified percentile (excluding boundaries) in a dataset.
PERCENTILE.EXC excludes boundary values, while PERCENTILE.INC includes them in the calculation.
No, the function is only applicable to numeric columns.
The function will return an error as k must be strictly between 0 and 1.
Yes, but filtering or aggregating data can enhance performance for extensive datasets.
Need Power BI help in a real engagement?
Our team writes DAX like this every day for SaaS finance and ops teams. Refresh monitoring, change requests with a 2-business-day SLA, and a named analyst on retainer — or scoped hourly help if you just need a fix.
Named analyst2-day SLAFrom $5K/mo
