Dax Function: T.DIST.RT
 Reviewed by Neetu Singla — Founder, Lets Viz Technologies — AI & Data Consultant. Last reviewed June 5, 2026.
Category: Statistical Functions
The T.DIST.RT function in Power BI is a statistical DAX function that calculates the right-tailed probability of the Student’s t-distribution. It is primarily used in hypothesis testing to determine the likelihood of observing a t-value greater than a specified value.
Purpose
The purpose of the T.DIST.RT function is to evaluate the probability that a random variable TT (following the t-distribution) is greater than a given t-value. This function is crucial in right-tailed hypothesis tests, where only deviations above the mean are considered significant.
Type of Calculations
Right-Tailed Probability: The function calculates the cumulative probability in the right tail of the t-distribution, starting from a given t-value.
Practical Use Cases
One-Tailed Hypothesis Testing: Evaluate whether a result significantly exceeds the expected mean.
Critical Value Comparisons: Compare observed t-values with right-tailed probabilities to assess statistical significance.
Risk Analysis: Determine the probability of extreme outcomes exceeding a threshold in datasets.
T.DIST.RT(<x>, <deg_freedom>)</deg_freedom></x>
| Parameter | Type | Description |
|---|---|---|
X | Scalar | The t-value for which the right-tailed probability is calculated. |
Deg_freedom | Scalar | The degrees of freedom, typically n−1n – 1, where nn is the sample size. Must be ≥ 1. |
How Does T.DIST.RT Dax Works
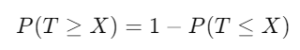
The T.DIST.RT function computes the cumulative probability for the right tail of the t-distribution:
Where:
T = t-statistic.
P( T ≤ X ) is derived from the cumulative distribution function (CDF).
What Does It Return?
Type: Decimal number.
Meaning: The probability of observing a t-value greater than the specified X, in the right tail of the t-distribution.
When Should We Use It?
Right-Tailed Tests: Situations where you are interested in deviations greater than the mean.
Significance Testing: Assess the p-value for one-sided hypothesis tests.
Quality Control: Determine if observed values exceed acceptable thresholds.
Examples
Basic Usage :
T.DIST.RT(1.5, 10)
Result: Calculates the probability of observing a t-value greater than 1.5 with 10 degrees of freedom.
Dynamic T-Value Calculation
T.DIST.RT(SUM(Sales[Profit]) / AVERAGE(Sales[Profit]), 15)
Result: Computes the right-tailed probability for a dynamically calculated t-statistic with 15 degrees of freedom.
Advanced Usage with Filtering
CALCULATE(T.DIST.RT(SUMX(Sales, Sales[Profit] - AVERAGE(Sales[Profit])), 20), FILTER(Sales, Sales[Region] = "West"))
Result: Calculates the right-tailed probability for a t-statistic derived from filtered profit data.
Tips and Tricks
Accurate Degrees of Freedom: Ensure \text{Deg_freedom} accurately reflects your sample size to avoid incorrect probabilities.
Combine with T.INV.RT: Use T.INV.RT to calculate the critical t-value for a specified probability.
Visualize Thresholds: Pair with T.DIST to compare one-tailed and two-tailed probabilities.
Potential Pitfalls
Invalid degrees of freedom (e.g., less than 1) result in errors.
Ensure X represents a meaningful t-value to interpret results effectively.
Performance Impact of T.DIST.RT DAX Function:
Efficient for small to moderately sized datasets.
For large datasets, ensure efficient DAX queries by pre-aggregating data or using filters.
Related Functions You Might Need
Want to Learn More?
For more information, check out the official Microsoft documentation for T.DIST.RT You can also experiment with this function in your Power BI reports to explore its capabilities.
Discover the full potential of Power BI by transforming your data into actionable insights with guidance from our expert consulting team. From mastering complex DAX formulas and building intuitive dashboards to optimizing data models for peak performance, our experienced Power BI professionals deliver tailored strategies to support your business goals. Visit our Power BI Consulting Services page to see how we can help your organization drive intelligent, data-based decisions.
It calculates the right-tailed probability of observing a t-value greater than the specified value in a t-distribution.
While T.DIST calculates the cumulative probability for a t-value, T.DIST.RT focuses only on the right tail.
Yes, but probabilities for negative values represent deviations below the mean.
The function will return an error if the degrees of freedom are less than 1.
It helps compute p-values for right-tailed tests, where only positive deviations are considered significant.
Need Power BI help in a real engagement?
Our team writes DAX like this every day for SaaS finance and ops teams. Refresh monitoring, change requests with a 2-business-day SLA, and a named analyst on retainer — or scoped hourly help if you just need a fix.
Named analyst2-day SLAFrom $5K/mo
