Dax Function: PERCENTILEX.INC
 Reviewed by Neetu Singla — Founder, Lets Viz Technologies — AI & Data Consultant. Last reviewed June 5, 2026.
Category: Statistical Functions
The PERCENTILEX.INC function in Power BI is a DAX function used to calculate the kk-percentile (inclusive) of a dataset. Unlike PERCENTILE.INC, this function works within a specified table or expression, allowing more flexibility in dynamically evaluating data.
Purpose of the Function
Determine the value below which a specified percentage of dynamically evaluated data falls, including boundary values.
Type of Calculations
Performs percentile analysis based on calculated expressions over a dataset.
Practical Use Cases
- Analyzing performance thresholds across groups.
- Calculating percentiles for aggregated or filtered data.
- Creating dynamic percentile-based benchmarks in dashboards.
PERCENTILEX.INC(<table>, <expression>, <k>)</k></expression></table>
| Parameter | Type | Description |
|---|---|---|
<Table> | Table | The table over which the percentile calculation is performed. |
<Expression> | Scalar | The expression to evaluate for each row of the table to determine the dataset. |
<K> | Scalar | A numeric value between 0 and 1 (inclusive) that represents the desired percentile. |
How Does PERCENTILEX.INC Dax Works
Mathematical Principle
For each row in the table, evaluate the
<Expression>, producing a dataset.Sort the resulting dataset in ascending order.
Use the formula for position:
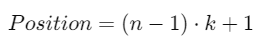
n: Number of values in the dataset.
k: Percentile parameter.
Return the value at the calculated position:
If the position is an integer, return the corresponding value.
If not, interpolate between the closest two values.
Example:
For n = 5, k = 0.4:
Sorted dataset: [10, 20, 30, 40, 50]
Position = ( 5 − 1 ) ⋅ 0.4 + 1 = 2.6
Result = Interpolated between the 2nd (20) and 3rd (30) values.
What Does It Return?
Returns a scalar value representing the inclusive k-percentile of the evaluated expression across the table.
When Should We Use It?
Dynamic Data Analysis: When percentile calculations depend on expressions or filters.
Grouped Percentile Analysis: To analyze percentiles for subcategories or groups in the dataset.
Custom Metrics: To create KPIs based on percentile thresholds.
Examples
Basic Usage :
Find the 90th percentile of sales across a dataset:
PERCENTILEX.INC(Sales, Sales[Amount], 0.9)
Output: Returns the sales amount below which 90% of sales values fall.
Column Usage
Calculate percentiles dynamically for each product:
ADDCOLUMNS(
Products,
"90th Percentile",
PERCENTILEX.INC(Sales, Sales[Amount], 0.9)
)
Use Case: Adds a column showing the 90th percentile of sales for each product.
Advanced Usage
Combine with filters for conditional percentile calculations:
CALCULATE(
PERCENTILEX.INC(Sales, Sales[Amount], 0.75),
Sales[Region] = "North"
)
Use Case: Calculates the 75th percentile for sales in the “North” region.
Tips and Tricks
Data Cleansing: Ensure the evaluated expression returns valid numeric results.
Boundary Values: Use
PERCENTILEX.EXCif boundaries should be excluded.Aggregation: Use aggregation functions (e.g.,
SUMX) within the expression to handle complex data structures.
Performance Impact of PERCENTILEX.INC DAX Function:
Optimize performance by reducing table size with filters or summarizing data.
Avoid unnecessary computations in
<Expression>for large datasets.
Related Functions You Might Need
PERCENTILEX.EXC: Excludes boundary values from percentile calculations.
AVERAGEX: Computes average dynamically across a table or expression.
SUMMARIZE: Useful for grouping and filtering data before applying
PERCENTILEX.INC.
Want to Learn More?
For more information, check out the official Microsoft documentation for PERCENTILEX.INC You can also experiment with this function in your Power BI reports to explore its capabilities.
Unlock the full capabilities of Power BI and elevate your data insights with our specialized consulting services. Whether you need guidance on advanced DAX functions like those highlighted here, support in designing interactive dashboards, or expertise in optimizing data models for enhanced performance, our experienced Power BI consultants are equipped to deliver customized solutions for your business. Explore our Power BI Consulting Services page to discover how we can help your organization make smarter, data-driven decisions.
It calculates the kk-percentile (inclusive) of a dynamically evaluated expression over a table.
PERCENTILEX.INC allows for dynamic evaluation of expressions, while PERCENTILE.INC operates on static column values.
No, the evaluated expression must return numeric values only.
The function returns the minimum or maximum value of the evaluated dataset, respectively.
Yes, but filtering or pre-aggregating data can improve performance.
Need Power BI help in a real engagement?
Our team writes DAX like this every day for SaaS finance and ops teams. Refresh monitoring, change requests with a 2-business-day SLA, and a named analyst on retainer — or scoped hourly help if you just need a fix.
Named analyst2-day SLAFrom $5K/mo
