Dax Function: VARX.P
 Reviewed by Neetu Singla — Founder, Lets Viz Technologies — AI & Data Consultant. Last reviewed June 5, 2026.
Category: Statistical Functions
The VARX.P function in Power BI is a DAX (Data Analysis Expressions) function used to calculate the population variance for a dynamically evaluated expression over rows in a table. This function is particularly useful when working with a complete dataset rather than a sample.
Purpose
The VARX.P function is designed to:
Measure the variability of values in a complete dataset.
Perform variance analysis for calculated expressions dynamically for each row.
Support precise statistical computations for population data.
Type of Calculations
Population Variance: Computes the degree of dispersion or spread of data points in a dataset by evaluating a user-defined expression for each row in a table.
Unlike VAR.P, VARX.P calculates variance dynamically for custom expressions instead of directly on static columns.
Practical Use Cases
Company-Wide Metrics: Analyze the variance in company-wide sales or revenue data based on dynamic calculations.
Custom KPI Variability: Evaluate the variance of calculated KPIs, such as employee performance scores or machine uptime percentages.
Dynamic Segmentation Analysis: Assess variability across entire populations for specific segments.
VARX.P(<table>, <expression>)</expression></table>
| Parameter | Type | Description |
|---|---|---|
<Table> | Table | The table containing the data for which the variance is calculated. |
<Expression> | Expression | A DAX expression evaluated for each row in the table. |
How Does VARX.P Dax Works
The VARX.P function computes variance based on the following formula:
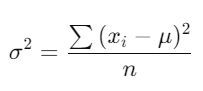
Where:
xi = Each value calculated from the expression.
μ = Mean of the evaluated values.
N = Total number of data points in the population.
The Expression is evaluated for each row in the Table.
The mean (μ) of the evaluated results is calculated.
Deviations from the mean are squared, summed, and divided by N.
This computation assumes the dataset represents the entire population.
What Does It Return?
Type: Decimal number.
Meaning: Returns the variance of the evaluated expression for the entire population.
When Should We Use It?
When the dataset represents the entire population instead of a sample.
For variance analysis of dynamically evaluated expressions across complete datasets.
To measure overall variability for precise and comprehensive analytics.
Examples
Basic Usage :
VARX.P(Products, Products[Revenue] - Products[Cost])
Result: Calculates the population variance of profit (Revenue – Cost) across all rows in the Products table.
Column-Based Usage
VARX.P(Sales, Sales[Quantity] * Sales[Price])
Result: Computes the population variance of total sales by multiplying Quantity and Price.
Advanced Usage
VARX.P(
FILTER(Sales, Sales[Region] = "Global"),
Sales[Revenue] - Sales[Discount]
)
Result: Calculates the population variance of net revenue (Revenue – Discount) for rows in the Sales table where Region is “Global”.
Tips and Tricks
Understand Data Scope: Use VARX.P only when working with complete datasets. For samples, consider VARX.S.
Optimize Expressions: Write simple and efficient expressions for better performance on large datasets.
Pair with Filters: Apply
FILTERor other DAX functions to focus on specific rows for population analysis.
Common Pitfalls
Using VARX.P on a dataset that is not the entire population may lead to misleading results.
Incorrect or non-numeric expressions can cause calculation errors.
Performance Impact of VARX.P DAX Function:
Efficiency: Minimize complexity in the evaluated expression to enhance performance in large datasets.
Filters: Use filtering strategically to reduce unnecessary calculations and focus analysis.
Related Functions You Might Need
Want to Learn More?
For more information, check out the official Microsoft documentation for VARX.P You can also experiment with this function in your Power BI reports to explore its capabilities.
Maximize the potential of Power BI and gain deeper insights from your data with our expert consulting services. Whether you’re looking for help with complex DAX formulas, creating dynamic and interactive dashboards, or improving data model efficiency for better performance, our seasoned Power BI professionals are here to provide tailored solutions to fit your business needs. Visit our Power BI Consulting Services page to learn how we can support your organization in making more informed, data-driven decisions.
The VARX.P function calculates the population variance of a dynamic expression over a table.
VARX.P computes variance for an entire population, while VARX.S calculates variance for a sample dataset.
Yes, you can use DAX functions like FILTER to apply conditions before evaluating the variance.
It returns the population variance of the evaluated expression as a decimal number.
Use VARX.P when you need population variance for a dynamically evaluated expression, and VAR.P for static column data.
Need Power BI help in a real engagement?
Our team writes DAX like this every day for SaaS finance and ops teams. Refresh monitoring, change requests with a 2-business-day SLA, and a named analyst on retainer — or scoped hourly help if you just need a fix.
Named analyst2-day SLAFrom $5K/mo
