Dax Function: EXPON.DIST
 Reviewed by Neetu Singla — Founder, Lets Viz Technologies — AI & Data Consultant. Last reviewed June 5, 2026.
Category: Statistical Functions
The EXPON.DIST function calculates the exponential distribution, which is often used to model the time between events in a Poisson process (e.g., time between arrivals of customers at a store). It can return either the probability density function (PDF) or the cumulative distribution function (CDF).
Purpose of the Function
To analyze the probability of an event occurring within a specific time frame.
Type of Calculations
Statistical probability distributions.
Practical Use Cases
- Modeling wait times (e.g., time before a machine failure, time before the next event in a process).
- Reliability analysis in engineering.
- Forecasting and queue management.
EXPON.DIST(x, lambda, cumulative)
| Parameter | Type | Description |
|---|---|---|
x | Scalar | The value at which to evaluate the function (e.g., time). Must be ≥ 0. |
lambda | Scalar | The rate parameter (inverse of the mean). Must be > 0. |
cumulative | Boolean | Determines the form of the function: TRUE for CDF, FALSE for PDF. |
How Does EXPON.DIST Dax Works
Mathematical Principles
Probability Density Function (PDF):
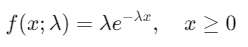
This represents the likelihood of the event occurring exactly at xx.
Cumulative Distribution Function (CDF):
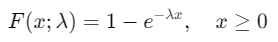
This represents the probability that the event occurs within x.
Key Points:
The parameter λ (lambda) is the rate parameter, representing how often events occur. A higher λ means events occur more frequently.
x must be non-negative, as the exponential distribution models time intervals, which cannot be negative.
What Does It Return?
The function returns:
PDF: The value of the probability density function for the specified x.
CDF: The cumulative probability that an event occurs within a given x.
When Should We Use It?
Queueing Systems: Estimate wait times in service systems.
Reliability: Model failure rates of systems and components.
Forecasting: Analyze inter-arrival times in event sequences.
Examples
Basic Usage :
Calculate the probability that an event occurs at exactly x=2, with a rate parameter λ=0.5, using the PDF:
EXPON.DIST(2, 0.5, FALSE)
Output: 0.030
Column Usage
Apply EXPON.DIST across a table of values to calculate cumulative probabilities for a dataset:
EXPON.DIST(Table[Time], Table[Rate], TRUE)
This evaluates the CDF for each row in the table.
Advanced Usage
Combine EXPON.DIST with other DAX functions to model dynamic scenarios, such as conditional probabilities:
IF([Time] > 0, EXPON.DIST([Time], [Rate], TRUE), 0)
Tips and Tricks
Choosing Lambda: Ensure λ aligns with your dataset’s time scale (e.g., events per second, minute, etc.).
CDF vs. PDF: Use CDF for cumulative probabilities and PDF for instantaneous probabilities.
Avoid Zero Lambda: A λ of zero is invalid and will cause errors.
Performance Impact of EXPON.DIST DAX Function:
Large Datasets: Pre-compute λ for efficiency when applying to multiple rows.
Dynamic Values: Avoid complex calculations for λ within the function; compute it separately for better performance.
Related Functions You Might Need
NORM.DIST: For normal distributions.
POISSON.DIST: For discrete event probabilities.
LOGNORM.DIST: For modeling log-normal distributions.
Want to Learn More?
For more information, check out the official Microsoft documentation for EXPON.DIST You can also experiment with this function in your Power BI reports to explore its capabilities.
Unlock the full capabilities of Power BI and elevate your data insights with our specialized consulting services. Whether you need guidance on advanced DAX functions like those highlighted here, support in designing interactive dashboards, or expertise in optimizing data models for enhanced performance, our experienced Power BI consultants are equipped to deliver customized solutions for your business. Explore our Power BI Consulting Services page to discover how we can help your organization make smarter, data-driven decisions.
It calculates probabilities using the exponential distribution, modeling the time between events.
PDF gives the probability at a specific x, while CDF provides cumulative probability up to x.
No, x must be non-negative.
Lambda represents the event rate (e.g., number of events per time unit).
Use a line chart to plot the PDF or CDF against x to show the probability distribution.
Need Power BI help in a real engagement?
Our team writes DAX like this every day for SaaS finance and ops teams. Refresh monitoring, change requests with a 2-business-day SLA, and a named analyst on retainer — or scoped hourly help if you just need a fix.
Named analyst2-day SLAFrom $5K/mo
