Dax Function: T.INV.2T
 Reviewed by Neetu Singla — Founder, Lets Viz Technologies — AI & Data Consultant. Last reviewed June 5, 2026.
Category: Statistical Functions
The T.INV.2T function in Power BI is a DAX statistical function used to compute the two-tailed inverse of the Student’s t-distribution. This function returns the critical t-value for a specified probability and degrees of freedom, where the cumulative probability is evenly split between the two tails.
Purpose
The purpose of the T.INV.2T function is to find the t-value that corresponds to the cumulative probability for a two-tailed hypothesis test. This is essential in scenarios where deviations in both directions (positive and negative) from the mean are considered.
Type of Calculations
Two-Tailed Critical Value: It calculates the t-value such that the specified probability is distributed equally in the two tails of the t-distribution.
Practical Use Cases
Two-Tailed Hypothesis Testing: Evaluate deviations in both directions from the expected value.
Confidence Interval Estimation: Determine t-values for constructing two-sided confidence intervals.
Quality Control: Analyze both upper and lower bounds of deviations in a process.
T.INV.2T(<probability>, <deg_freedom>)</deg_freedom></probability>
| Parameter | Type | Description |
|---|---|---|
Probability | Scalar | A numeric value between 0 and 1 representing the cumulative probability for the two tails combined. |
Deg_freedom | Scalar | The degrees of freedom, typically n−1n – 1, where nn is the sample size. Must be ≥ 1. |
How Does T.INV.2T Dax Works
The T.INV.2T function calculates the critical t-value such that the given probability PP is split equally between the two tails of the distribution. The function works as follows:
Divides the specified probability P by 2.
Calculates the critical t-value for the resulting one-tailed probability using the inverse cumulative distribution function:
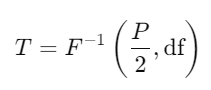
where T = critical t-value, P = cumulative probability, and df = degrees of freedom.
What Does It Return?
Type: Decimal number.
Meaning: The critical t-value for the given cumulative probability and degrees of freedom, considering a two-tailed distribution.
When Should We Use It?
Statistical Hypothesis Testing: When both extreme values (positive and negative deviations) are considered significant.
Confidence Intervals: For calculating bounds in two-tailed intervals.
Scientific Studies: Where bidirectional effects are equally relevant.
Examples
Basic Usage :
T.INV.2T(0.05, 10)
Result: Returns the critical t-value for a cumulative probability of 0.05 with 10 degrees of freedom. This is often used in a 95% confidence interval.
Column-Based Probability
T.INV.2T(SUM(Sales[Probability]), 15)
Result: Calculates the critical t-value for the total cumulative probability in the Sales[Probability] column with 15 degrees of freedom.
Advanced Usage
CALCULATE(T.INV.2T(0.01, MAX(Sales[DegreesOfFreedom])), FILTER(Sales, Sales[Category] = "A"))
Result: Returns the critical t-value for category “A” using the highest degrees of freedom found in the dataset and a cumulative probability of 0.01.
Tips and Tricks
Use with Confidence Levels: For a 95% confidence interval, set
Probabilityto 0.05 (5% split equally between two tails).Avoid Errors: Ensure
Probabilityis a small positive value (e.g., 0 < Probability ≤ 1).Degrees of Freedom: Use n − 1 where nn is the sample size for accurate results.
Common Pitfalls
Using probabilities greater than 1 or less than 0 will result in errors.
Misinterpreting two-tailed tests as one-tailed and using the wrong function ( e.g., T.INV ).
Performance Impact of T.INV.2T DAX Function:
Optimized for small datasets with precise cumulative probabilities.
For large datasets, pre-aggregating probabilities can improve performance.
Related Functions You Might Need
Want to Learn More?
For more information, check out the official Microsoft documentation for T.INV.2T You can also experiment with this function in your Power BI reports to explore its capabilities.
Leverage the full potential of Power BI to transform your data into impactful insights through our expert consulting services. Whether you need help with complex DAX formulas, building interactive dashboards, or streamlining data models for better performance, our experienced Power BI specialists deliver tailored solutions to meet your specific business goals. Visit our Power BI Consulting Services page to learn how we can support your organization in making data-informed strategic decisions.
It calculates the critical t-value for a given cumulative probability in a two-tailed Student’s t-distribution.
T.INV.2T computes critical t-values for two-tailed tests, while T.INV is used for one-tailed tests.
The function returns an error since probabilities must be between 0 and 1.
It determines the t-value bounds for a two-sided confidence interval based on the specified cumulative probability.
No, use T.INV for one-tailed tests to avoid incorrect calculations.
Need Power BI help in a real engagement?
Our team writes DAX like this every day for SaaS finance and ops teams. Refresh monitoring, change requests with a 2-business-day SLA, and a named analyst on retainer — or scoped hourly help if you just need a fix.
Named analyst2-day SLAFrom $5K/mo
