Dax Function: STDEV.S
 Reviewed by Neetu Singla — Founder, Lets Viz Technologies — AI & Data Consultant. Last reviewed June 5, 2026.
Category: Statistical Functions
The STDEV.S function in Power BI calculates the standard deviation of a sample population in a dataset. It measures the amount of variation or dispersion from the average (mean) in the data.
Purpose
The purpose of the STDEV.S function is to assess the variability of a sample within a dataset, helping users understand the spread or consistency of the data values. It’s particularly useful for statistical analysis in scenarios where data represents a sample of a larger population.
Type of Calculations
The function calculates the square root of the average of the squared deviations of each data point from the sample mean. This provides insight into how much the data varies within the sample.
Practical Use Cases
Quality Control: Determine consistency in manufacturing processes.
Risk Assessment: Analyze variations in stock market prices.
Performance Analysis: Evaluate deviations in sales, performance metrics, or survey responses.
Research Data Analysis: Analyze sample data variability in scientific experiments.
STDEV.S(<column>)</column>
| Parameter | Type | Description |
|---|---|---|
column | Column | A column containing numerical values to calculate the sample standard deviation. |
How Does STDEV.S Dax Works
The mathematical principle behind STDEV.S is based on the formula for sample standard deviation:
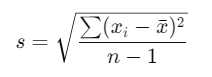
Where:
: Individual data point.
x̄: Sample mean.
n: Number of data points.
The function automatically:
Calculates the mean of the column.
Computes the squared deviations from the mean for each data point.
Divides the sum of squared deviations by n − 1 (to account for sample bias).
Returns the square root of the result.
What Does It Return?
Type: Decimal number.
Meaning: The function returns the sample standard deviation of the values in the specified column.
When Should We Use It?
When analyzing data variability in a sample, rather than the entire population.
When comparing the spread of different datasets.
In predictive modeling and statistical inference tasks.
Examples
Basic Usage :
STDEV.S({1, 2, 3, 4, 5})
Result: 1.58 (approx.).
Column Usage
Assume a table Sales with a column Revenue:
STDEV.S(Sales[Revenue])
Result: The standard deviation of the Revenue column values.
Advanced Usage
Combine with CALCULATE to filter data before calculating:
STDEV.S(FILTER(Sales, Sales[Region] = "North"))
Result: Standard deviation of Revenue for the “North” region.
Tips and Tricks
Ensure the data column is numerical; non-numerical values will cause errors.
Use STDEV.P if analyzing the entire population instead of a sample.
Pair with filters (e.g., CALCULATE) for segmented analysis.
Potential Pitfalls
Including null or non-numerical data will return errors or incorrect results.
Using on non-representative samples can mislead results.
Performance Impact of STDEV.S DAX Function:
- For large datasets, computation may take longer. Consider using pre-aggregated data or applying filters to limit data scope.
Related Functions You Might Need
Want to Learn More?
For more information, check out the official Microsoft documentation for STDEV.S You can also experiment with this function in your Power BI reports to explore its capabilities.
Make the most of Power BI by transforming your data into valuable insights with support from our seasoned consultants. Whether you’re looking for guidance on complex DAX formulas, designing interactive and user-friendly dashboards, or enhancing data model efficiency, our expert Power BI team provides tailored solutions aligned with your business goals. Head over to our Power BI Consulting Services page to discover how we can help your organization make smarter, data-driven decisions.
STDEV.S calculates the standard deviation for a sample, while STDEV.P is for the entire population.
No, null values are ignored in the calculation.
Numerical data in a column.
Use it when analyzing variability in a sample dataset.
STDEV.S returns the standard deviation, whereas VAR.S returns the variance.
Need Power BI help in a real engagement?
Our team writes DAX like this every day for SaaS finance and ops teams. Refresh monitoring, change requests with a 2-business-day SLA, and a named analyst on retainer — or scoped hourly help if you just need a fix.
Named analyst2-day SLAFrom $5K/mo
