Dax Function: POISSON.DIST
 Reviewed by Neetu Singla — Founder, Lets Viz Technologies — AI & Data Consultant. Last reviewed June 5, 2026.
Category: Statistical Functions
The POISSON.DIST function in Power BI is a DAX function used to calculate the Poisson probability distribution. It predicts the probability of a given number of events occurring in a fixed interval, given a known average rate of occurrence.
Purpose of the Function
Model events that happen independently within a specific time or space interval.
Type of Calculations
Probability computations based on the Poisson distribution.
Practical Use Cases
- Estimating the likelihood of receiving a specific number of customer calls in an hour.
- Predicting the occurrence of defects in a batch of products.
- Modeling arrival rates, such as buses at a station or transactions per second.
POISSON.DIST(<x>, <mean>, <cumulative>)</cumulative></mean></x>
| Parameter | Type | Description |
|---|---|---|
<X> | Scalar | The number of events for which the probability is calculated. Must be a non-negative integer. |
<Mean> | Scalar | The expected number of events in the interval. Must be a positive number. |
<Cumulative> | Boolean | Determines the type of probability: TRUE for cumulative probability and FALSE for probability mass function (PMF). |
How Does POISSON.DIST Dax Works
Mathematical Principle
The Poisson distribution is defined as:
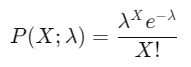
: Probability of X events.
λ: Mean number of events (< Mean >).
e: Euler’s number (~2.71828).
X!: Factorial of X.
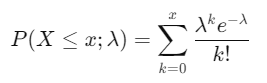
For cumulative probability:
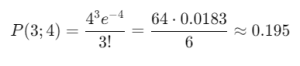
Example:
For X = 3, λ = 4, and cumulative = FALSE:
What Does It Return?
Returns a scalar value representing either the probability of exactly
<X>events (when<Cumulative>isFALSE) or the cumulative probability of up to<X>events (when<Cumulative>isTRUE).
When Should We Use It?
Discrete Event Prediction: For independent events happening over time or space.
Defect Rates: In quality control to assess the probability of defects.
Queue Management: Modeling arrival or service rates in queue systems.
Rare Event Analysis: Estimating probabilities for infrequent occurrences, such as equipment failures.
Examples
Basic Usage :
Calculate the probability of receiving exactly 3 calls in an hour when the average rate is 4 calls per hour:
POISSON.DIST(3, 4, FALSE)
Output: ~0.195 (19.5%).
Column Usage
Predict defect probabilities in a dynamic dataset:
ADDCOLUMNS(
DefectData,
"DefectProbability",
POISSON.DIST(DefectData[ActualDefects], DefectData[MeanDefects], FALSE)
)
Use Case: Adds a column displaying the probability of observing the given number of defects for each record.
Advanced Usage
Combine with conditional logic for analysis:
IF(
POISSON.DIST(X, Mean, FALSE) > 0.2,
"High Probability",
"Low Probability"
)
Use Case: Categorize probabilities dynamically based on a threshold.
Tips and Tricks
Understand the Distribution: Use when events are independent and occur at a constant average rate.
Avoid Negative Values: Ensure
<X>is non-negative and<Mean>is positive.Check Type of Probability: Use
FALSEfor exact probabilities andTRUEfor cumulative probabilities.Combine with Visuals: Plot the probability distribution to better understand event likelihoods.
Performance Impact of POISSON.DIST DAX Function:
Calculations are lightweight for small values of
<Mean>and<X>.Avoid using with very large datasets without pre-aggregation, as cumulative calculations may slow down performance.
Related Functions You Might Need
Want to Learn More?
For more information, check out the official Microsoft documentation for POSSION.DIST You can also experiment with this function in your Power BI reports to explore its capabilities.
Harness the full potential of Power BI to convert your data into meaningful, results-oriented insights with guidance from our experienced consulting team. Whether you need help with advanced DAX logic, building intuitive and visually compelling dashboards, or enhancing the efficiency of your data models, our Power BI specialists offer solutions tailored to your organization’s unique requirements. Visit our Power BI Consulting Services page to see how we can support smarter, data-driven decision-making within your business.
It calculates the Poisson probability distribution for a given number of events and mean rate.
Cumulative (TRUE) gives the probability of up to X events; non-cumulative (FALSE) gives the exact probability for X events.
No, <X> must be non-negative, and <Mean> must be positive.
Use it for independent events occurring at a constant average rate over time or space.
Create a bar chart showing probabilities for various X-values.
Need Power BI help in a real engagement?
Our team writes DAX like this every day for SaaS finance and ops teams. Refresh monitoring, change requests with a 2-business-day SLA, and a named analyst on retainer — or scoped hourly help if you just need a fix.
Named analyst2-day SLAFrom $5K/mo
