Dax Function: STDEVX.S
Category: Statistical Functions
The STDEVX.S function in Power BI calculates the sample standard deviation of values generated by an expression evaluated over a table. It is part of the X family of aggregation functions in DAX, allowing row-by-row evaluation and aggregation.
Purpose
The primary purpose of the STDEVX.S function is to measure the variability or dispersion of results obtained by evaluating a custom expression across a table. Unlike STDEV.S, which works directly on a column of data, STDEVX.S enables advanced calculations where you define the logic for deriving values dynamically.
Type of Calculations
STDEVX.S calculates the sample standard deviation of the values derived from a user-defined expression. The calculation involves:
Evaluating the expression for each row in the specified table.
Aggregating the results to compute the sample standard deviation.
Practical Use Cases
Dynamic Metrics: Analyze variability in dynamically computed metrics, such as weighted averages or ratios.
Custom Aggregations: Perform standard deviation calculations on derived columns that don’t exist in the data model.
Segment Analysis: Evaluate variability across specific groups or segments using filters.
STDEVX.S(<table>, <expression>)</expression></table>
| Parameter | Type | Description |
|---|---|---|
table | Table | The table containing the rows to evaluate. |
expression | Expression | A DAX expression to be evaluated for each row of the table, resulting in numerical values. |
How Does STDEVX.S Dax Works
The STDEVX.S function follows the sample standard deviation formula:
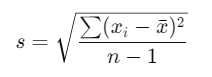
Row-by-Row Evaluation: The
expressionis computed for each row in thetable.Calculate Mean (x̄): The mean of the derived values is computed.
Compute Deviations: The squared differences between each value and the mean are calculated.
Aggregate and Normalize: The sum of these squared deviations is divided by n − 1, where n is the number of rows.
Return Result: The square root of the aggregated value is returned.
What Does It Return?
Type: Decimal number.
Meaning: The function returns the sample standard deviation of the values resulting from the evaluated expression.
When Should We Use It?
When working with calculated values that aren’t directly stored in a column.
For dynamic row-level computations in custom aggregations.
In advanced analytics requiring variability measurement across complex expressions.
Examples
Basic Usage :
STDEVX.S(Orders, Orders[Quantity] * Orders[UnitPrice])
Result: Computes the sample standard deviation of total order values derived by multiplying Quantity and UnitPrice.
Column Usage
Assume a table Sales with columns Discount and Profit:
STDEVX.S(Sales, Sales[Profit] - Sales[Discount])
Result: Calculates the sample standard deviation of profits after deducting discounts.
Advanced Usage
Use in combination with FILTER to evaluate a subset of data:
STDEVX.S(FILTER(Sales, Sales[Category] = "Electronics"), Sales[Profit] / Sales[Quantity])
Result: Computes the standard deviation of profit per unit for the “Electronics” category.
Tips and Tricks
Efficient Expression Design: Write efficient expressions for better performance, especially with large datasets.
Handle Nulls Gracefully: Ensure the
expressionaccounts for null or non-numerical values to avoid calculation errors.Combine with Other Functions: Pair with CALCULATE, FILTER, or SUMMARIZE for dynamic filtering and grouping.
Potential Pitfalls
Large tables may impact performance due to row-by-row evaluation.
Using non-numerical results in the
expressionwill lead to errors.
Performance Impact of STDEVX.S DAX Function:
Optimize the table and expression for faster computations, especially for large datasets.
Avoid overly complex expressions as they increase computational load.
Related Functions You Might Need
Want to Learn More?
For more information, check out the official Microsoft documentation for STDEVX.S You can also experiment with this function in your Power BI reports to explore its capabilities.
Harness the full potential of Power BI to transform your data into actionable business insights with guidance from our expert consultants. Whether it’s mastering complex DAX functions, designing intuitive and engaging dashboards, or improving the efficiency of your data models, our knowledgeable Power BI specialists provide solutions tailored to your organization’s unique needs. Explore our Power BI Consulting Services page to see how we can support your team in making data-driven, strategic decisions.
STDEVX.S evaluates an expression for each row in a table, while STDEV.S works directly on a single column.
Yes, null values are ignored in the computation.
Any table containing rows for which the expression can return numerical values.
Non-numerical values cause an error and must be handled using conditions like IF or ISNUMBER.
Use STDEVX.S for sample data and STDEVX.P when working with the entire population.