Dax Function: STDEV.P
Category: Statistical Functions
The STDEV.P function in Power BI calculates the standard deviation of a population dataset. It evaluates the degree of variation or spread of values in the dataset as a whole, assuming the data represents the entire population.
Purpose
The purpose of the STDEV.P function is to provide a measure of how much the values in a dataset deviate from their mean when analyzing a complete population. This is essential for understanding data consistency and distribution in statistical and analytical applications.
Type of Calculations
STDEV.P performs calculations based on the entire population dataset, following these steps:
Calculates the mean of all values.
Computes the squared deviation of each value from the mean.
Takes the square root of the average squared deviation.
This results in the population standard deviation.
Practical Use Cases
Business Insights: Analyze variability in total sales or revenue over time.
Scientific Research: Evaluate consistency in experimental results when the data represents the whole population.
Customer Data Analysis: Assess deviations in customer behavior or purchase amounts across a complete dataset.
Forecasting: Understand the spread of historical data to improve prediction accuracy.
STDEV.P(<column>)</column>
| Parameter | Type | Description |
|---|---|---|
column | Column | A column containing numerical values to calculate the population standard deviation. |
How Does STDEV.P Dax Works
The STDEV.P function relies on the mathematical formula for population standard deviation:
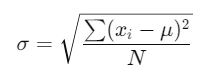
Where:
xi: Individual data point.
μ: Population mean.
N: Total number of data points.
Steps:
Compute the mean ( μ ) of the dataset.
Determine the squared difference between each value (xi) and the mean.
Find the average of these squared differences.
Take the square root of the result to get the population standard deviation.
What Does It Return?
Type: Decimal number.
Meaning: Returns the population standard deviation of the numerical values in the specified column.
When Should We Use It?
Use STDEV.P when the dataset represents the entire population, not a sample.
Ideal for large, comprehensive datasets like company-wide sales or all recorded transactions.
Examples
Basic Usage :
STDEV.P({2, 4, 6, 8, 10})
Result: 2.83 (approx.).
Column Usage
Assume a table Products with a column Profit:
STDEV.P(Products[Profit])
Result: The population standard deviation of all values in the Profit column.
Advanced Usage
Calculate the standard deviation for a filtered subset:
STDEV.P(FILTER(Sales, Sales[Category] = "Electronics"))
Result: The population standard deviation of Sales within the “Electronics” category.
Tips and Tricks
Population vs. Sample: Use STDEV.P for complete datasets; switch to STDEV.S for samples.
Data Cleaning: Ensure the column contains only numerical values. Non-numerical or null values may cause errors.
Combine with Filters: Apply CALCULATE or FILTER for segment-specific analysis.
Potential Pitfalls
Applying STDEV.P to a sample dataset will produce misleading results.
Null or non-numerical values in the column may distort calculations.
Performance Impact of STDEV.P DAX Function:
For large datasets, STDEV.P calculations may be computationally intensive. Consider pre-aggregating data or using filters to reduce processing time.
Related Functions You Might Need
Want to Learn More?
For more information, check out the official Microsoft documentation for STDEV.P You can also experiment with this function in your Power BI reports to explore its capabilities.
Take full advantage of Power BI by turning your data into meaningful insights with the help of our experienced consultants. Whether you need expertise in advanced DAX expressions, the creation of interactive and easy-to-use dashboards, or optimization of data models for better performance, our skilled Power BI professionals deliver customized solutions to meet your organization’s goals. Visit our Power BI Consulting Services page to learn how we can assist your team in making informed, strategic decisions backed by data.
STDEV.P calculates the standard deviation for a population, while STDEV.S is for a sample.
No, the column must contain numerical data only.
Null values are ignored in the calculation.
Combine with CALCULATE or FILTER to focus on specific segments of the data.
Use STDEV.P when the dataset represents the entire population.