Dax Function: PERCENTILE.INC
Category: Statistical Functions
The PERCENTILE.INC function in Power BI is a DAX function that calculates the value at a specified percentile (inclusive) from a dataset. This function includes the boundary values (minimum and maximum) in its calculations, making it suitable for comprehensive data analysis.
Purpose of the Function
Determine the value below which a specified percentage of data falls, including boundaries.
Type of Calculations
Computes inclusive quantiles based on a dataset.
Practical Use Cases
- Ranking items within a complete range of data.
- Identifying benchmarks for performance thresholds.
- Summarizing data distributions in dashboards or reports.
PERCENTILE.INC(<column>, <k>)</k></column>
| Parameter | Type | Description |
|---|---|---|
<Column> | Column | The column of data values for which the percentile is calculated. |
<K> | Scalar | A numeric value between 0 and 1 (inclusive) representing the desired percentile. |
How Does PERCENTILE.INC Dax Works
Mathematical Principle
For a dataset with nn elements sorted in ascending order:
Calculate the position index:
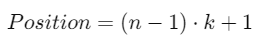
If the position is an integer, the function directly returns the value at that position.
If the position is not an integer, the function interpolates between the closest two data points.
For example:
n = 10, k = 0.3:
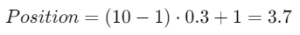
Interpolation occurs between the 3rd and 4th values.
What Does It Return?
The function returns a scalar value representing the calculated k-percentile.
This value reflects the position in the dataset where k percent of the data falls, including boundary values.
When Should We Use It?
Boundary-Inclusive Analysis: When it’s essential to consider the minimum and maximum values.
Benchmarking: Establish thresholds for data categories.
Percentile Reporting: Useful in KPIs and data visualizations for percentile insights.
Examples
Basic Usage :
Find the 90th percentile (inclusive) of a dataset:
PERCENTILE.INC(Sales[Amount], 0.9)
Output: Returns the value below which 90% of the data falls, including boundary values.
Column Usage
Calculate percentiles for each category:
ADDCOLUMNS(
Categories,
"90th Percentile",
PERCENTILE.INC(SUMMARIZE(Sales, Sales[Category]), 0.9)
)
Use Case: Add a column showing the 90th percentile of sales for each category.
Advanced Usage
Combine with filters to compute percentiles for specific conditions:
CALCULATE(
PERCENTILE.INC(Sales[Amount], 0.75),
Sales[Region] = "East"
)
Use Case: Calculate the 75th percentile of sales for the “East” region.
Tips and Tricks
Boundary Validation: Use k values between 0 and 1 (inclusive). Using k < 0 or k > 1 results in an error.
Data Cleansing: Ensure no null or non-numeric values in the dataset column.
Alternatives: Use
PERCENTILE.EXCif excluding boundaries is necessary.
Performance Impact of PERCENTILE.INC DAX Function:
Efficient for moderately sized datasets.
For extensive datasets, optimize by pre-aggregating or using filters.
Related Functions You Might Need
PERCENTILE.EXC: Excludes boundaries from percentile calculations.
MEDIAN: A specific percentile (50th percentile) without requiring kk.
RANKX: Ranks items for analysis alongside percentile thresholds.
Want to Learn More?
For more information, check out the official Microsoft documentation for PERCENTILE.INC You can also experiment with this function in your Power BI reports to explore its capabilities.
Unlock the full capabilities of Power BI and elevate your data insights with our specialized consulting services. Whether you need guidance on advanced DAX functions like those highlighted here, support in designing interactive dashboards, or expertise in optimizing data models for enhanced performance, our experienced Power BI consultants are equipped to deliver customized solutions for your business. Explore our Power BI Consulting Services page to discover how we can help your organization make smarter, data-driven decisions.
It calculates the value at a specified percentile (including boundaries) for a dataset.
PERCENTILE.INC includes boundary values in its calculation, while PERCENTILE.EXC excludes them.
No, the column should not contain null or non-numeric values.
The function returns the minimum or maximum value of the dataset, respectively.
Yes, but filtering or pre-aggregating data can improve performance.