Dax Function: NORM.S.DIST
Category: Statistical Functions
The NORM.S.DIST function in Power BI is a DAX (Data Analysis Expressions) function used to calculate the standard normal cumulative distribution function (CDF) or the probability density function (PDF). It assumes a mean of 0 and a standard deviation of 1, focusing on the standard normal distribution.
Purpose of the Function
To evaluate the probability or cumulative probability of a given z-score within the standard normal distribution.
Type of Calculations
Computes cumulative probability (area under the curve) or the probability density for a given z-score.
Practical Use Cases
- Evaluate probabilities in hypothesis testing.
- Compute z-score percentiles.
- Analyze deviations from the mean in standardized datasets.
NORM.S.DIST(<z>, <cumulative>)</cumulative></z>
| Parameter | Type | Description |
|---|---|---|
<Z> | Scalar | The zz-score for which the distribution is evaluated. Represents the number of standard deviations from the mean. |
<Cumulative> | Boolean | Determines the type of distribution to compute: TRUE for cumulative probability (CDF), FALSE for probability density (PDF). |
How Does NORM.S.DIST Dax Works
Mathematical Principle
The function evaluates the standard normal distribution formula:
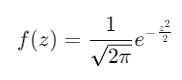
Probability Density Function (PDF):
Cumulative Distribution Function (CDF):
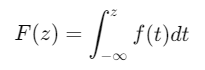
Where:
z is the input z-score.
e is the base of the natural logarithm.
What Does It Return?
The NORM.S.DIST function returns:
A numeric value:
If
<Cumulative>isTRUE, it returns the cumulative probability.If
<Cumulative>isFALSE, it returns the probability density at the specified zz-score.
Values range between 0 and 1.
When Should We Use It?
Standardized Datasets: Analyze data that has been normalized to a standard normal distribution.
Statistical Analysis: Calculate probabilities or densities for zz-scores in hypothesis testing or quality control.
Percentile Analysis: Find where a data point falls in the standard normal distribution.
Examples
Basic Usage :
Find the cumulative probability for a z-score of 1.5:
NORM.S.DIST(1.5, TRUE)
Output: Approximately 0.9332 (the cumulative probability up to z = 1.5 ).
Column Usage
Apply the function to a column of zz-scores to compute cumulative probabilities:
ADDCOLUMNS(
Scores,
"CumulativeProbability",
NORM.S.DIST(Scores[ZScore], TRUE)
)
Use Case: Add a column showing cumulative probabilities for each -score in the dataset.
Advanced Usage
Combine with filtering to find cumulative probabilities for a subset of data:
CALCULATE(
NORM.S.DIST(Sales[ZScore], TRUE),
Sales[Category] = "Electronics"
)
Use Case: Compute probabilities specific to the “Electronics” category.
Tips and Tricks
Boolean Parameter: Use
TRUEfor cumulative probabilities andFALSEfor density values to avoid confusion.Input Validation: Ensure zz-scores are valid and represent standard deviations from the mean.
Preprocessing: Standardize datasets before applying the function for meaningful results.
Performance Impact of NORM.S.DIST DAX Function:
Efficient for small-to-medium datasets.
For large datasets, consider precomputing values if probabilities need frequent recalculations.
Related Functions You Might Need
NORM.DIST: Calculates probabilities for normal distributions with custom mean and standard deviation.
NORM.INV: Finds the zz-score for a given cumulative probability.
PERCENTILEX.INC: Computes percentiles in datasets.
Want to Learn More?
For more information, check out the official Microsoft documentation for NORM.S.DIST You can also experiment with this function in your Power BI reports to explore its capabilities.
Unlock the full capabilities of Power BI and elevate your data insights with our specialized consulting services. Whether you need guidance on advanced DAX functions like those highlighted here, support in designing interactive dashboards, or expertise in optimizing data models for enhanced performance, our experienced Power BI consultants are equipped to deliver customized solutions for your business. Explore our Power BI Consulting Services page to discover how we can help your organization make smarter, data-driven decisions.
It calculates the cumulative probability or density of a given zz-score in the standard normal distribution.
Cumulative (TRUE) calculates the probability up to a zz-score, while density (FALSE) computes the height of the distribution curve at z.
No, it is specifically designed for the standard normal distribution (mean = 0, standard deviation = 1).
The range is between 0 and 1, representing probabilities.
Yes, but for frequent calculations, precomputing values may improve performance.