Financial Reporting: Statements, Types and Power BI Setup
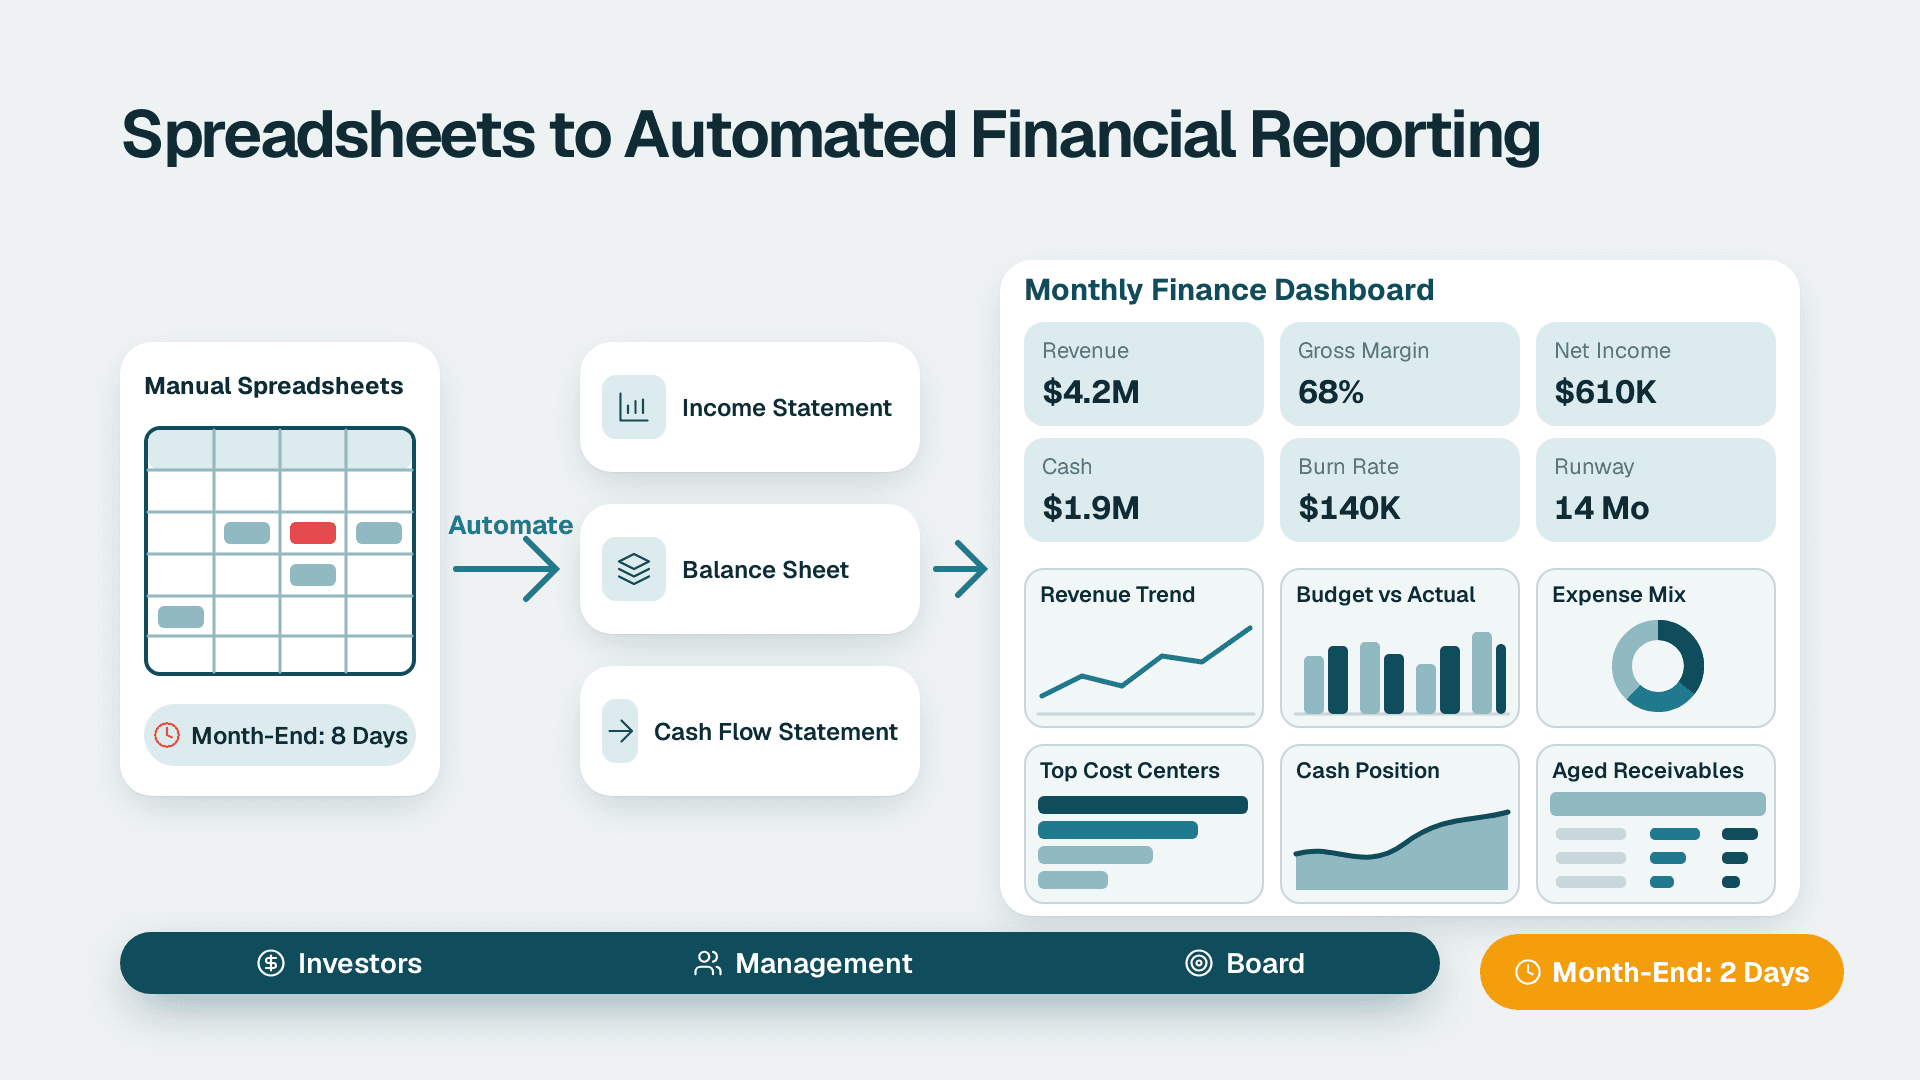
Financial reporting is the process of turning a company's accounting records into formal statements - the income statement, balance sheet and cash flow statement - plus the management and board reports built on top of them. For a SaaS or SMB finance team, the goal is a repeatable monthly cycle, which usually means moving from spreadsheets to automated Power BI reporting.
Key Takeaways
- Financial reporting covers external statements, internal management reports and board packs, and each serves a different reader.
- The three core statements (income statement, balance sheet, cash flow statement) must tie to each other and to the general ledger.
- SaaS teams need subscription metrics and deferred revenue alongside the standard statements.
- Spreadsheets stop scaling when versions, manual copy-paste and reconciliation consume the close; a BI layer fixes the delivery, not the accounting.
- Move to Power BI in stages: stabilise the data, model it once, then automate refresh and distribution.
What Is Financial Reporting and What Does It Mean for Business?
The meaning of financial reporting is simple: it is the structured communication of a company's financial position, performance and cash movements to the people who rely on them. Those people include executives, lenders, investors, auditors, tax authorities and, increasingly, the operating managers who run budgets.
It helps to separate two layers. Accounting financial reporting is the rule-bound layer. It follows a framework such as US GAAP or IFRS, and its output is the set of statements that an auditor can sign. Management reporting is the decision layer. It uses the same underlying numbers but adds the cuts leaders actually need: by product, region, customer cohort, department or sales rep.
Financial reporting for business is only useful when both layers agree. If the board deck says one revenue number and the ledger says another, the team spends the next meeting arguing about data rather than direction. That is why the finance function owns the process end to end, from journal entries through to the final chart.
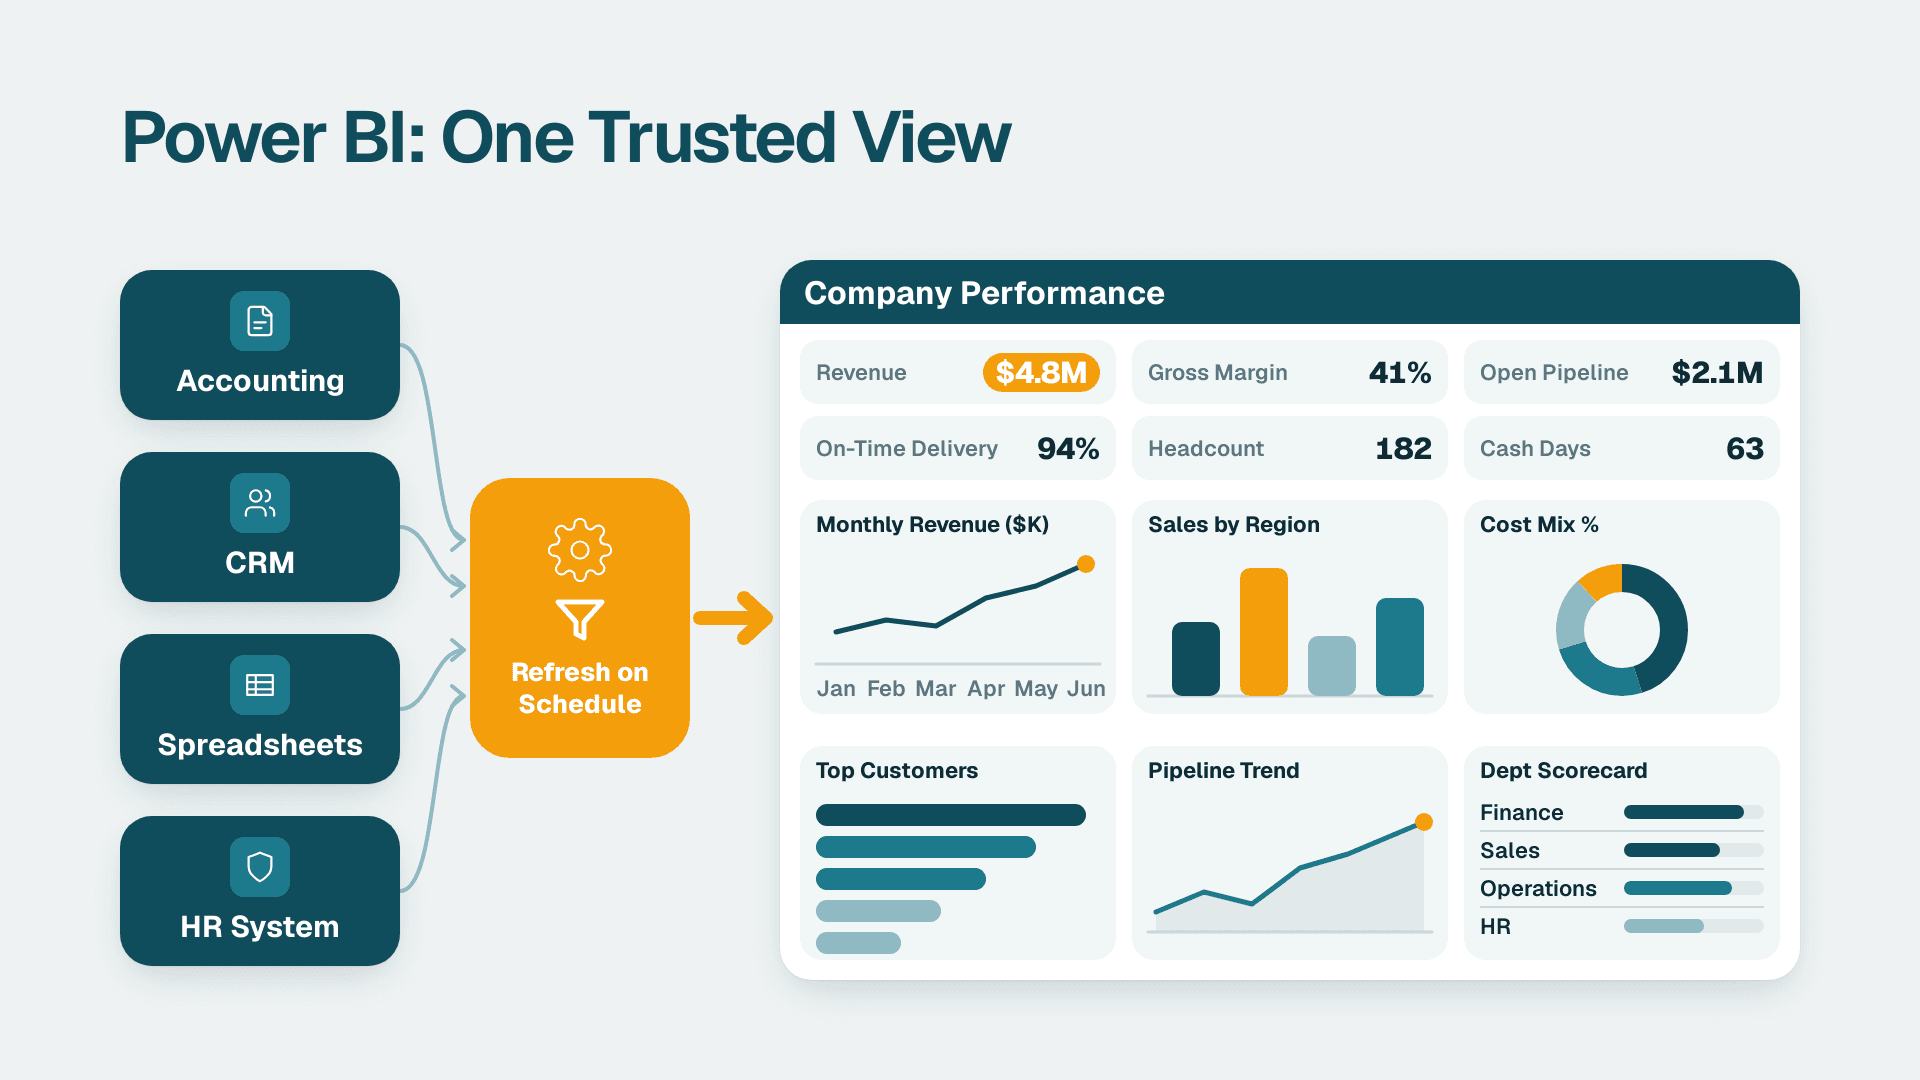
For SaaS companies the picture has a few extra moving parts. Revenue recognition for subscriptions follows ASC 606 in the US and IFRS 15 in the UK and EU, which means billings, deferred revenue and recognised revenue are three different numbers. A US SaaS team reporting to a venture investor, a UK fintech preparing for a lender, and a Canadian software company answering to a parent group all face the same core problem: one set of books, many audiences. A purpose-built Power BI for SaaS finance teams setup is designed around exactly that problem, so the same governed numbers feed every audience.
What Does a Financial Report Consist Of?
A financial report consists of the core financial statements, the notes that explain them, and, in management settings, supporting schedules and commentary. The statements are the backbone, so it is worth being precise about each one.
| Statement | What it answers | Key structure |
|---|---|---|
| **Income statement** (profit and loss) | Did the business make money in this period? | Revenue, cost of goods sold, gross profit, operating expenses, net income |
| **Balance sheet** | What does the business own and owe at a point in time? | Assets = Liabilities + Owners' Equity |
| **Cash flow statement** | Where did cash come from and go? | Operating, investing and financing activities |
| **Statement of retained earnings** | How much profit was kept rather than distributed? | Opening balance, net income, dividends, closing balance |
The income statement
An income statement, also called a profit and loss (P&L) statement, summarises the cumulative effect of revenue, gain, expense and loss transactions over a period, according to the Harvard Business School Online guide to reading financial statements. Gross profit is total revenue less cost of goods sold. Operating income is gross profit less operating expenses. Income before taxes subtracts non-operating expenses, and net income subtracts taxes. Earnings per share divides net income by outstanding shares, and EBITDA strips out interest, taxes, depreciation and amortization to show operating earnings before those items.
The balance sheet
The balance sheet rests on the accounting equation: assets equal liabilities plus owners' equity. Its five main parts are current assets, fixed (long-term) assets, current liabilities, long-term liabilities and shareholders' equity, as set out in this overview of the four financial statements. For a SaaS company, deferred revenue sits in current liabilities and is often the single most scrutinised line.
The cash flow statement
The cash flow statement has three sections: operating, investing and financing. Cash flow is not profit. Cash flow is the money moving in and out, while profit is what remains after expenses are deducted from revenue. A subscription business that bills annually upfront can show strong cash and modest profit in the same quarter, which is why this statement matters so much to founders.
There are two ways to build it. The direct method lists actual cash transactions. The indirect method starts with net income and adjusts for non-cash items, and it is the more common choice among large companies.
The statement of retained earnings
This is the least commonly used statement and is typically included only in an audited statement package. Many internal reporting packs skip it, but lenders and auditors expect it.
What Is the Difference Between a Financial Statement and an Annual Report?
A financial statement is one formal document (such as the balance sheet), while an annual report is the broader package a company publishes each year. The annual report contains the audited financial statements, but it also adds the notes, management commentary, strategy discussion, risk factors and governance disclosures.
The wider term financial report is looser still. As this explanation of financial reports versus financial statements describes, financial reports are documents relating to the financial health of a business, such as reports on growth, assets and expenses. In practice, finance teams use the hierarchy below.
- Financial statements: the standardised statements, governed by accounting rules.
- Financial reports: statements plus analysis, schedules and commentary for a specific audience.
- Annual report: the formal yearly publication, usually audited, for shareholders and regulators.
Private SaaS and SMB companies often never publish an annual report in the public sense. They still produce annual statements for lenders, investors and tax filings, and a monthly pack for internal use.
What Are the Main Types of Financial Reporting?
The main types of financial reporting are external (statutory and regulatory), management (internal), board and investor reporting, and operational KPI reporting. Each has a different audience, cadence and tolerance for estimates.
| Type | Audience | Typical cadence | Key content |
|---|---|---|---|
| **External / statutory** | Auditors, tax authorities, regulators | Annual, sometimes quarterly | Audited statements, notes, tax filings |
| **Management reporting** | CFO, department heads | Monthly | P&L by department, budget vs actual, variance commentary |
| **Board and investor reporting** | Directors, investors | Monthly or quarterly | Summary statements, cash runway, KPIs, forecast |
| **Operational KPI reporting** | Functional leaders | Weekly or daily | Pipeline, billings, churn, collections |
| **Lender / covenant reporting** | Banks, credit providers | Quarterly | Covenant ratios, compliance certificates |
Management and board reporting
Management reporting is where finance earns its place at the leadership table. It answers why the numbers moved, not just what they were. A good monthly pack compares actuals to budget and prior period, explains the largest variances in plain language, and carries a rolling forecast.
Board reporting is a compressed version. Directors want a small number of trusted figures, the cash position and runway, and a clear view of risks. Over-long packs usually signal that the team does not yet trust its own summary. For design guidance on what to include, see how to build a KPI dashboard leadership actually uses.
SaaS-specific reporting
SaaS finance adds a subscription layer to the standard types. Common items include monthly and annual recurring revenue, net revenue retention, gross margin by revenue stream, customer acquisition cost payback, and the bridge from billings to recognised revenue. These are not defined by accounting standards, so each company must document its own definitions. Undocumented definitions are the most common reason two decks disagree.
What Is Corporate Financial Reporting and Who Owns It?
Corporate financial reporting is the full cycle of collecting transactions, closing the books, preparing statements and distributing them to stakeholders under a defined governance model. Ownership is shared, but accountability sits with the CFO or finance director.
A workable division of labour looks like this:
| Stage | Owner | Output |
|---|---|---|
| Transaction capture | AP, AR, payroll, billing | Clean sub-ledgers |
| Month-end close | Controller | Reconciled trial balance, journals |
| Statement preparation | Controller / accounting manager | Income statement, balance sheet, cash flow |
| Analysis and commentary | FP&A | Variance analysis, forecast, KPI pack |
| Review and approval | CFO / finance director | Signed-off management and board pack |
| Distribution and access | Finance systems / BI owner | Governed dashboards and scheduled packs |
The close is the hinge. If review notes and audit trail live in email threads, the pack is slow and hard to defend. A structured approach is covered in how to handle month-end close review notes and audit trail.
Cadence matters too. A reasonable rhythm for a growing SaaS company is daily cash and collections visibility, weekly pipeline and billing KPIs, a monthly close with the full management pack by a fixed business day, and a quarterly board pack with reforecast. The exact day is less important than that it is fixed and met.
Why Is Financial Reporting So Important?
Financial reporting is important because every material decision - hiring, pricing, fundraising, borrowing, acquiring - depends on numbers people trust. It also carries legal weight: statutory filings, tax returns and investor covenants all require accurate statements.
There are four practical reasons finance leaders care.
1. Decision quality. Leaders act on what they see. Late or inconsistent numbers push decisions to instinct.
2. Cash discipline. A cash flow view, separate from profit, shows runway and collection risk before they become emergencies.
3. Credibility. Investors, lenders and acquirers read the quality of reporting as a proxy for the quality of management.
4. Compliance. Depending on market, that means GAAP or IFRS alignment, audit readiness, and data protection duties. A UK or EU team must consider GDPR when reports contain personal data, a Canadian team must consider PIPEDA, and a US team selling to enterprise buyers is often asked for SOC 2 evidence covering how financial data is handled.
What Data Stack Sits Behind Reliable Financial Reporting?
Reliable financial reporting rests on four layers: a general ledger as the system of record, source systems feeding it, a governed data model, and a presentation layer. Skipping the third layer is the usual cause of reporting pain.
- System of record: the accounting platform or ERP that holds the general ledger.
- Source systems: billing and subscription tools, CRM, payroll, banking, expense tools.
- Data model: a single, documented set of tables and measures that define revenue, margin, headcount cost and the SaaS metrics once, so every report reuses them.
- Presentation layer: the dashboards, packs and scheduled emails that people actually read.
Spreadsheets tend to collapse layers three and four into one workbook. That works while one person owns it. It breaks when a second person needs to update it, or when the board asks for a different cut.
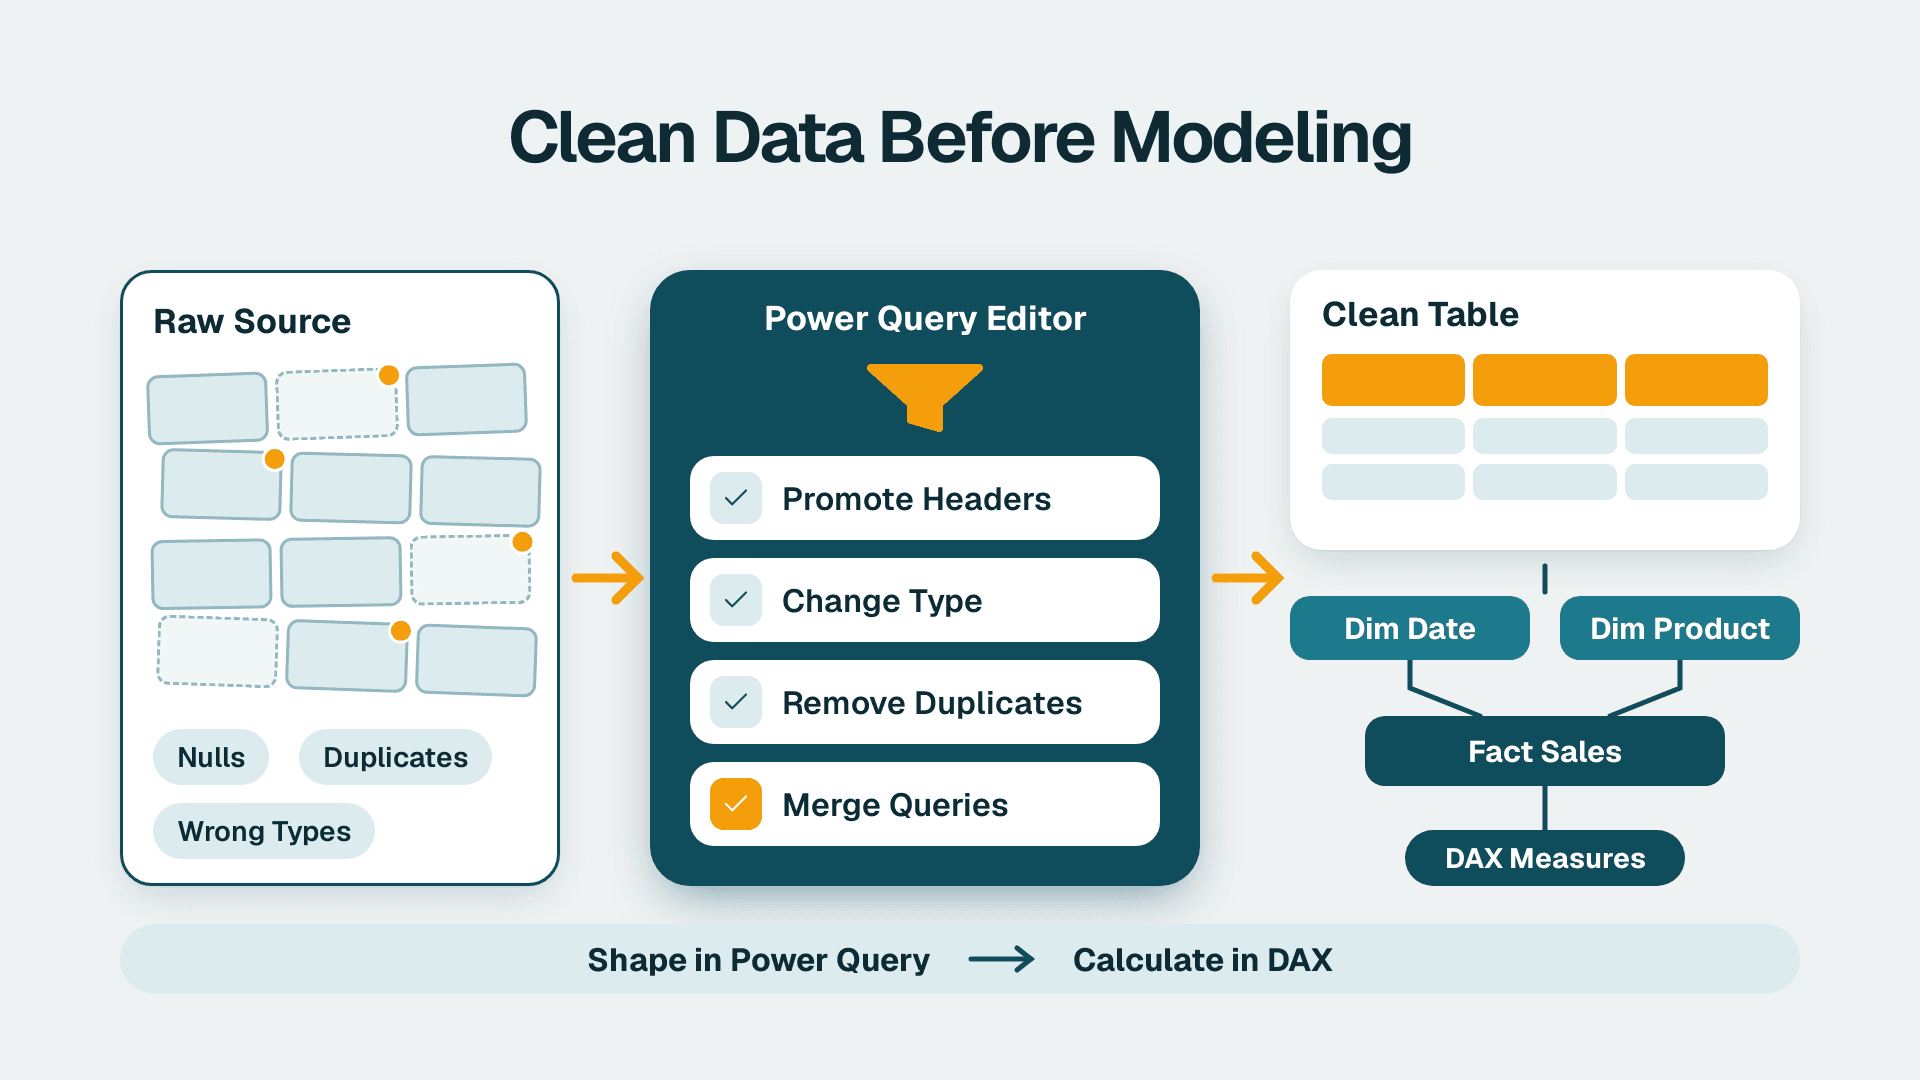
Data quality comes first. Before any new reporting layer, check that chart-of-accounts mappings, customer IDs and date logic are consistent. A practical checklist is in how to run an ERP data quality check before AI implementation, and the same checks apply before any AI-assisted FP&A work, since AI amplifies whatever quality the data already has.
When Does a BI Layer Beat Spreadsheets?
A BI layer beats spreadsheets when the same numbers are rebuilt every month, when more than one person edits them, or when leaders need to drill from a summary to the underlying transactions. Spreadsheets remain excellent for ad hoc modelling, so the decision is not either/or.
| Criterion | Spreadsheet-based reporting | Automated Power BI reporting |
|---|---|---|
| Refresh | Manual copy-paste each close | Scheduled refresh from source |
| Version control | Multiple files and email attachments | One governed dataset and report |
| Definitions | Embedded in formulas, vary by author | Defined once as measures |
| Drill-down | Limited, separate tabs | From summary to transaction |
| Access control | File-level sharing | Role-based, row-level security |
| Audit trail | Manual and fragile | Traceable refresh and lineage |
| Best for | Ad hoc analysis, scenario models | Recurring packs, KPI dashboards, board reporting |
Three signals suggest it is time to move:
1. The close pack takes days of assembly rather than hours of review.
2. Finance spends more time reconciling reports than explaining them.
3. Leaders have asked for self-service views that finance cannot supply without a rebuild.
Examples of what good looks like are collected in financial dashboard examples for better decision-making.
How Do You Move Financial Reporting From Spreadsheets to Power BI?
You move in five stages: stabilise the data, model it once, rebuild the core reports, automate refresh and distribution, then govern. Trying to do all five at once is the most common reason projects stall.
Step 1: Stabilise the numbers
Pick the reports that matter most, usually the P&L, balance sheet, cash flow and a short KPI page. Agree definitions in writing. Fix chart-of-accounts mapping problems at source rather than patching them in the report.
Step 2: Keep Excel in the loop where it belongs
Many teams keep budget inputs and adjustments in Excel. That is fine if the files are structured and the connection is automatic. The steps are covered in how to connect Excel to Power BI with automatic refresh.
Step 3: Build one model and reconcile it
Load ledger data and source-system data into a single model. Then prove it. Totals in Power BI must match the general ledger before anyone trusts the dashboard. If they do not, follow the process in why Power BI reports disagree with the general ledger.
Step 4: Automate refresh and distribution
Schedule data refresh to land before the close review, and use subscriptions or alerts so the pack reaches directors without manual exporting. The full workflow for the monthly cycle is in how to automate monthly financial reporting in Power BI. For a broader pipeline view, including AI-assisted steps, see how to build an AI automated reporting pipeline.
Step 5: Govern access and change
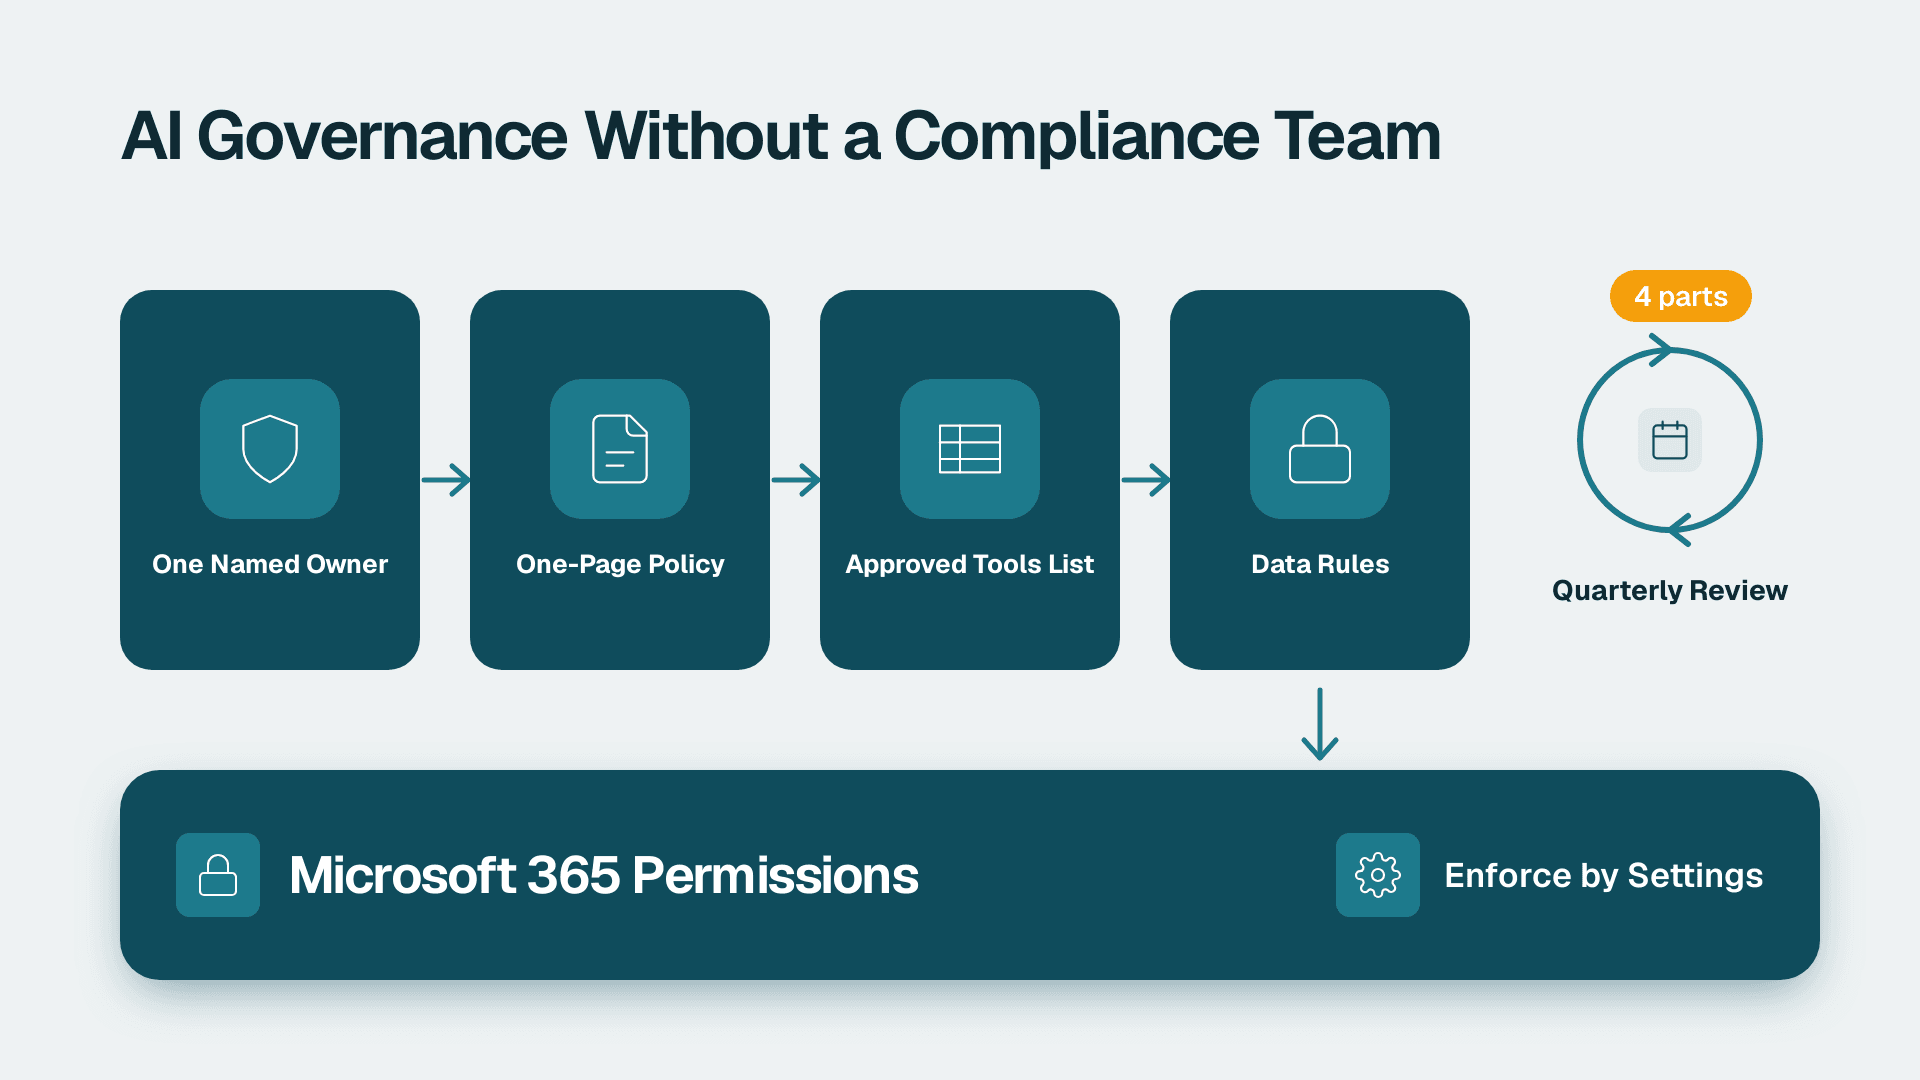
Finance data is sensitive. Use role-based access so department heads see their own cost centres, restrict the consolidated view, and keep a change log for report logic. A UK fintech holding customer-level data should treat GDPR obligations as a design input, not an afterthought, and a Canadian group should consider PIPEDA when data crosses borders. A change record such as the one described in AI change log for Power BI reports supports both audit and internal control.
What Does Automated Financial Reporting in Power BI Cost?
Licence cost is modest relative to the finance hours it frees. According to Microsoft's list prices in effect since 1 April 2025, Power BI Pro is $14 per user per month and Power BI Premium Per User is $24 per user per month. Suppose a 10-person finance and leadership group needs access: the licence line is a small, predictable number, and the larger cost is the one-off modelling and reconciliation work.
| Option | List price | What it suits |
|---|---|---|
| Power BI Pro | $14 per user/month | Most SMB and mid-market finance teams sharing governed reports |
| Premium Per User | $24 per user/month | Teams needing larger models and premium features per user |
| Paid Fabric capacity (F2 or higher) or Premium P1 or higher | Varies by capacity | Required if you want Copilot in Power BI |
One point worth knowing before you plan around AI features: Copilot in Power BI and Fabric needs a paid Fabric capacity of F2 or higher, or Premium P1 or higher. A Pro or PPU licence alone is not enough, and trial capacities are excluded. For a full comparison, read Power BI Pro vs PPU vs Fabric: which licence you need. If your reports will later sit on Fabric, how to migrate a Power BI workspace to Microsoft Fabric covers the path.
For teams still deciding where to start, the free BI readiness self-assessment gives a quick view of data, skills and governance gaps, and the instant project cost calculator helps size the build.
What Should a Finance Leader Do Next?
Start with the report, not the tool. List the five reports your leadership and board genuinely use, name an owner for each, fix the close date, and write down every metric definition. Then check that the data feeding them reconciles to the ledger. Only after that does automation pay off, because automating an unreliable report just distributes the wrong number faster.
A sensible first 90 days looks like this: month one on definitions and data fixes, month two on the model and reconciliation, month three on the automated close pack and board view. Keep spreadsheets for scenario modelling, and let the BI layer carry everything recurring.
If you want a SaaS-specific build that covers recurring revenue metrics, deferred revenue and board reporting, see Power BI for SaaS finance teams.
---
About Lets Viz: Lets Viz is a data analytics consulting firm that has built reporting and BI solutions since 2020, serving US healthcare, UK fintech, Canadian manufacturing and global SaaS organisations. Our team holds a 5.0 Clutch rating and works daily with finance leaders on governed, auditable reporting in Power BI.
Sources
- How to Read Financial Statements: A Beginner's Guide
- The Four Types of Financial Statements Explained
- Financial Reports vs. Financial Statements: Key Differences
Facts and prices checked October 2026.