How to Connect Excel to Power BI With Automatic Refresh
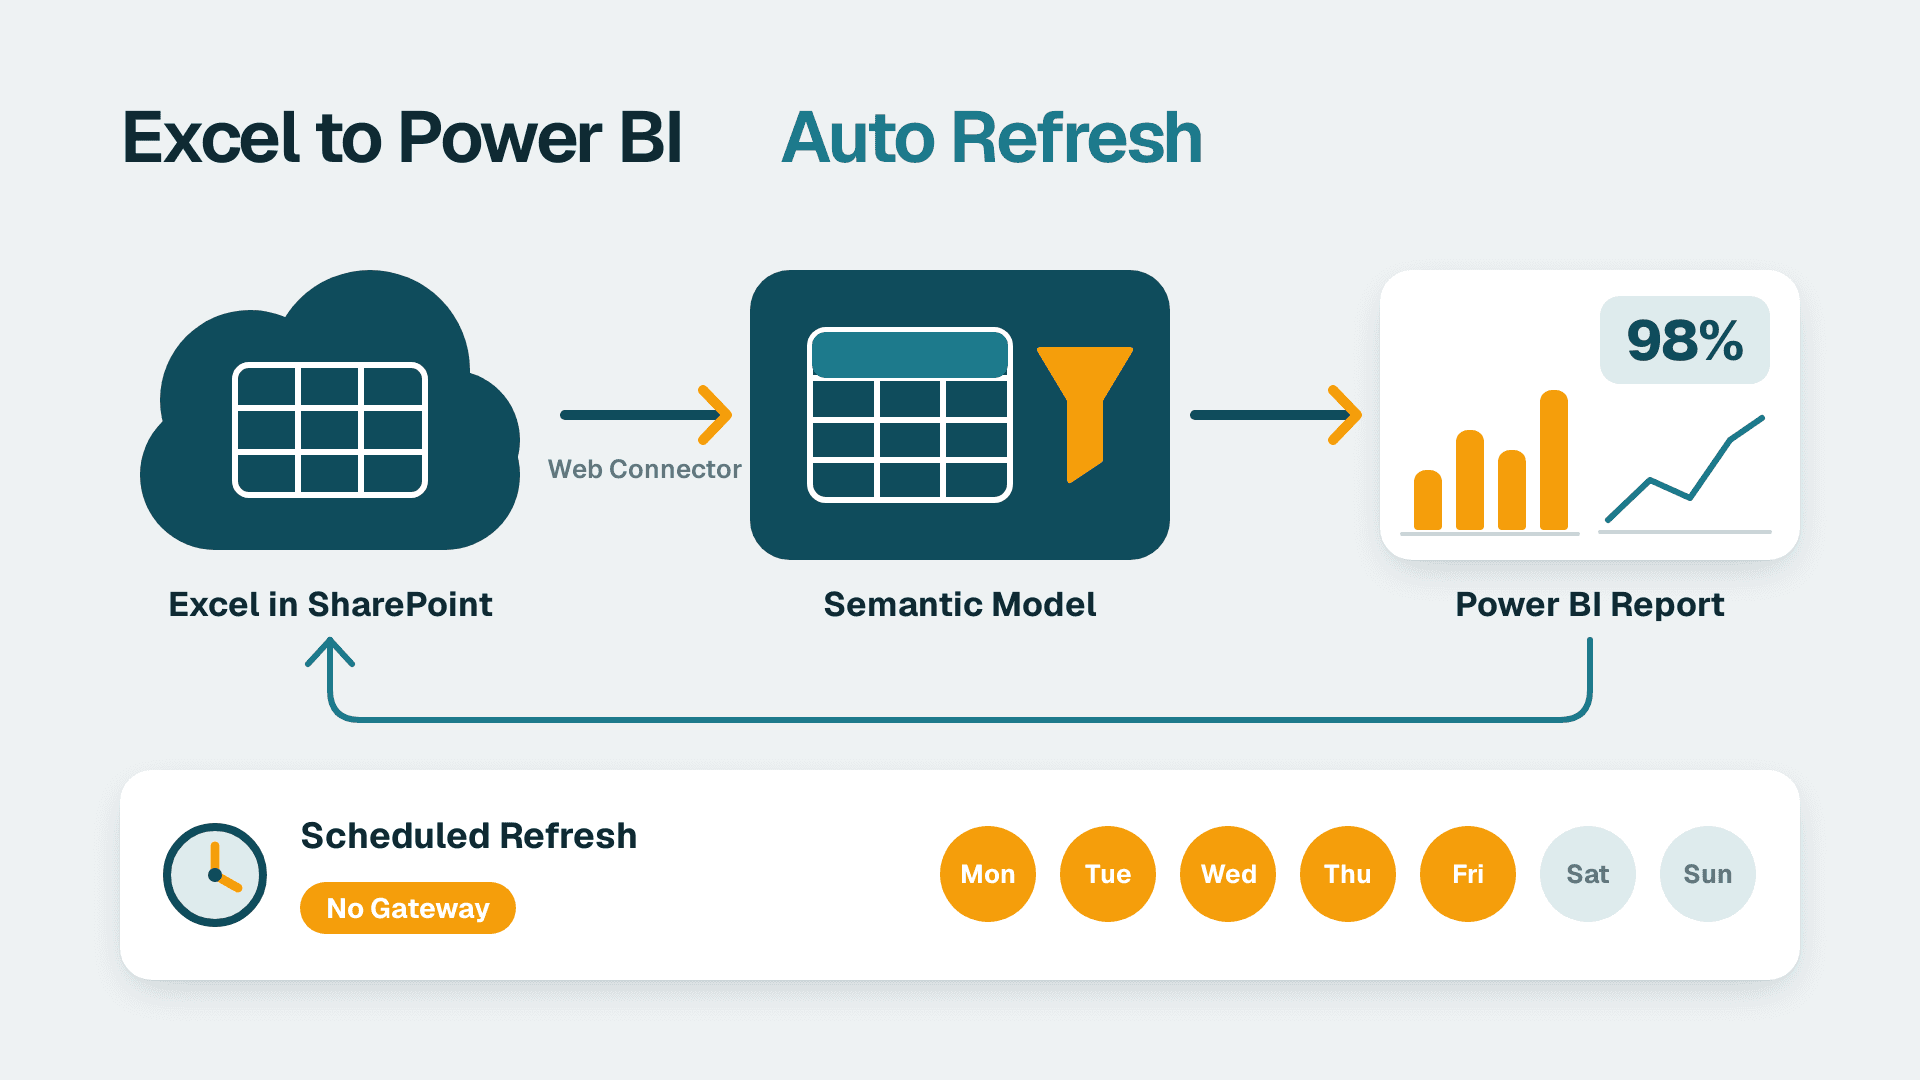
By the end of this guide you will have an Excel workbook stored in SharePoint or OneDrive for Business feeding a Power BI semantic model that refreshes on a schedule, with no gateway and no manual re-publishing. Allow about 45 minutes for your first workbook, and roughly 10 minutes for each one after that.
This pattern matters during an ssrs to power bi migration or any move off a legacy BI tool. Finance and operations teams still keep reference tables, targets, and mapping sheets in Excel. If those sheets are connected the wrong way, your new dashboards go stale within a week and trust in the migration erodes.
What You'll Need
- A Power BI Pro licence ($14 per user/month list price) for the person publishing and for each person viewing a shared report, or Premium Per User ($24 per user/month) if you use that tier.
- Power BI Desktop, installed and signed in with your work account.
- A Microsoft 365 work or school account with edit access to a SharePoint Online document library or OneDrive for Business.
- An Excel workbook in .xlsx format where the data sits in a formatted Table (Insert > Table) or a named range, with one header row and no merged cells.
- Workspace role of Member, Contributor, or Admin in the Power BI Service workspace you will publish to.
- Permission to edit data source credentials on the semantic model. You must be the model owner, or take over ownership first.
- Your tenant's SharePoint domain. Confirm it before you start, because the URL format differs by cloud (see Step 2).
Step 1: Prepare the workbook in SharePoint or OneDrive
The refresh only works if the Service can reach the file over the internet. A file on a laptop or a network drive needs an on-premises data gateway, which is exactly what we are avoiding.
1. Open the workbook in Excel and select your data range.
2. Go to Insert > Table, tick My table has headers, and click OK.
3. On the Table Design tab, rename the table in the Table Name box to something stable, for example `tblTargets`. Power BI will reference this name, so changing it later breaks the query.
4. Save the file to a SharePoint document library (for shared, team-owned data) or OneDrive for Business (for personal data).
Prefer SharePoint for anything the business depends on. A OneDrive file belongs to one person, and when that person leaves, the file can be deleted with their account and every report built on it stops refreshing.
What you should see: the file appears in the library with a normal Excel icon and the status bar in Excel shows Saved to followed by your site name.
Step 2: Copy the correct file address for your Microsoft 365 tenant
Most failures at this stage come from copying the wrong URL form. Get the address from the file itself.
1. In SharePoint or OneDrive in your browser, open the file's ... menu and choose Details (or Manage access then Copy link). The simplest route is to open the workbook in Excel for the web.
2. In Excel for the web, go to File > Info and click Copy path. If you do not see it, use File > Share > Copy link instead.
3. Paste the result into a text editor and delete everything from the `?` onward (for example `?web=1` or `?e=abc123`). You want only the clean path ending in `.xlsx`.
The domain tells you which cloud you are on:
- Commercial cloud (most US and UK/EU tenants): `https://yourcompany.sharepoint.com/sites/Finance/Shared Documents/targets.xlsx`. OneDrive for Business files live at `https://yourcompany-my.sharepoint.com/personal/name_yourcompany_com/...`.
- US government clouds (GCC High and DoD): these use the `.sharepoint.us` domain. Power BI for these clouds is also hosted separately, so confirm your Service address with your tenant admin before publishing.
- UK and EU tenants with Multi-Geo: the domain can carry a geography suffix such as `yourcompany-eur.sharepoint.com`. Data residency itself does not change the connection method, only the host name in the address.
- China (operated by 21Vianet): uses `.sharepoint.cn`.
If you are unsure which applies, check the address bar when you browse to your SharePoint home page. Whatever host appears there is the host you must use.
What you should see: a single line of text starting with `https://`, containing your host, and ending in `.xlsx` with no question mark.
Step 3: Connect from Power BI Desktop using the Web connector
Do not use Get data > Excel workbook and browse to a synced folder. That stores a local path such as `C:\Users\...\OneDrive`, which the Service cannot reach. Use the web address instead.
1. Open Power BI Desktop and select Home > Get data > More....
2. Search for Web, select it, and click Connect.
3. Paste the clean URL from Step 2 into the URL box and click OK.
4. In the authentication dialog, select Organizational account in the left menu, click Sign in, and use your work account. Then click Connect.
5. In the Navigator window, tick your table (for example `tblTargets`) rather than the sheet name. Tables show a table icon; sheets show a grid icon.
6. Click Transform Data.
What you should see: Power Query Editor opens with your rows and headers. If you instead see a single column called Data or a binary icon, the URL was not clean, so go back to Step 2.
Alternative: SharePoint Folder connector
When you want to pick up every file in a library, or when file names change monthly, use Get data > SharePoint Folder instead. Enter only the site address, such as `https://yourcompany.sharepoint.com/sites/Finance`, not the file path. Filter the Folder Path and Name columns, then click the Content binary link. This route is more robust for recurring monthly drops, because one query handles all files.
Step 4: Clean the data and set the types in Power Query
Workbooks maintained by hand are the main source of refresh errors, so fix types now.
1. In Power Query Editor, select the first row if headers are not detected and choose Home > Use First Row as Headers.
2. Click each column header icon and set the correct type: Date, Decimal Number, or Text.
3. Remove blank rows with Home > Remove Rows > Remove Blank Rows.
4. Rename the query in the Properties pane on the right to something readable, such as `Targets`.
5. Click Close & Apply.
Here is a small modelling example. If your workbook holds a target per region and your fact table holds only a region code, you can look it up in a measure or column using DAX LOOKUPVALUE:
```
Region Target = LOOKUPVALUE(Targets[Target], Targets[RegionCode], Sales[RegionCode])
```
This returns the target for the matching region code. It errors if more than one Targets row matches a code, so keep that column unique in the workbook. For a filtered total from the same sheet, a FILTER pattern works too:
```
EMEA Target = CALCULATE(SUM(Targets[Target]), FILTER(Targets, Targets[Region] = "EMEA"))
```
What you should see: the Data pane lists your `Targets` table with a sigma icon next to numeric fields and no yellow warning bar about errors.
Step 5: Publish the report to the Power BI Service
1. Save the .pbix file locally.
2. Select Home > Publish.
3. Choose the destination workspace in the dialog and click Select.
4. When publishing completes, click Open 'filename.pbix' in Power BI.
What you should see: a success message with a link, and in the browser a workspace listing that shows both a Report and a Semantic model with your file name.
If you are deciding whether this workspace should sit on Pro or in a Fabric capacity, read the guide on Microsoft Fabric architecture for finance reporting. The choice between Power BI and Fabric for a legacy BI migration turns on whether you need pipelines and lakehouse storage. A small number of Excel-based reference tables does not.
Step 6: Set the data source credentials in the Service
This is the step most people skip, and it is why the first scheduled refresh fails.
1. In the workspace, hover over the semantic model and click ... (More options), then Settings.
2. Expand Data source credentials. If you see a banner saying credentials are not valid, that is expected on first publish.
3. Click Edit credentials next to the Web or SharePoint source.
4. Set Authentication method to OAuth2.
5. Set Privacy level setting for this data source to Organizational.
6. Make sure Skip test connection is unticked, then click Sign in, complete the Microsoft sign-in, and accept any consent prompt.
What you should see: the data source row no longer shows a red warning, and the Gateway and cloud connections section reports that no gateway is needed for cloud sources.
Step 7: Schedule the automatic refresh
1. Still in the semantic model Settings page, expand Refresh.
2. Turn Configure a refresh schedule to On.
3. Choose your Refresh frequency (Daily or Weekly) and your Time zone.
4. Click Add another time to add each run. Per Microsoft documentation (2025), semantic models on shared capacity support a limited number of scheduled refreshes per day, and Premium or Fabric capacities allow more. Check the current limit for your licence before planning half-hourly runs.
5. Tick Send refresh failure notifications to the semantic model owner and add a shared mailbox under Contacts so a failure does not land with one person.
6. Click Apply.
7. Test it immediately: back in the workspace, click the Refresh now icon next to the semantic model.
What you should see: after a minute, the Refresh history link (under ... > Refresh history) shows a row with status Completed and a fresh timestamp.
For guidance on time-of-day planning and dependencies between models, see how to set up a Power BI data refresh schedule without breaking reports.
Make the refresh timing line up with the people editing the file
If analysts update the workbook at 9:00 and the refresh runs at 8:00, your dashboard is always a day behind. Agree an update cut-off with the workbook owners and schedule the refresh 30 minutes after it. Also remember that Excel autosave can capture a half-finished edit, so ask owners to finish changes before the cut-off.
Common Mistakes
- Connecting to a synced local path. Choosing Excel workbook and browsing to your OneDrive folder stores a `C:\` path, and the Service shows a gateway-required error. Fix: delete the query and reconnect using the Web connector with the clean SharePoint URL from Step 2.
- Leaving `?web=1` or `?e=` on the address. The connector returns HTML or a single binary column instead of a table. Fix: trim everything from the question mark onward in Data source settings (Home > Transform data > Data source settings > Change Source).
- Pointing at a sheet name instead of a Table. Adding a row at the bottom of a sheet is picked up inconsistently, and blank formatted rows add empty records. Fix: convert the range to a Table and select the table in the Navigator.
- Renaming the table or moving the file. Both break the query on the next refresh. Fix: lock the table name, keep the file in a stable library, and update the source under Data source settings if a move is unavoidable.
- Publishing under a personal account that later leaves. The refresh then fails because the credentials belong to a disabled user. Fix: use Take over in the model Settings to move ownership to a service owner, then re-enter credentials.
Troubleshooting
- Refresh history shows "The credentials provided for the data source are invalid." The OAuth token has expired or the signed-in account lost access to the library. Re-open Edit credentials, sign in again, and confirm that the account can open the file in the browser.
- Refresh succeeds but the report shows old numbers. The file was updated in a different copy, or a dashboard tile is cached. Check that the URL points at the live library and not a downloaded duplicate, then open the report and use Refresh to reload the visuals.
- Error mentions the column or table 'was not found'. Someone renamed a header or the table in Excel. Restore the original name, or edit the step in Power Query > Applied Steps to match, then publish again.
Where this fits in a wider migration
Excel-fed models are a good first win because they are quick to build and prove that the refresh chain works end to end. Once that works, you can inventory the rest of the legacy estate. Our Power BI Copilot readiness checklist covers the governance conditions to meet, and the free BI readiness self-assessment gives you a scored view of where your current reporting stands.
Two practical notes for the BI leads reading this. First, track who owns every Excel source. A shared workbook with no named owner is the single biggest risk in this pattern, and it is worth recording owners and cut-off times in your migration runbook. Second, when budgeting the programme, model licences first using the instant project cost calculator, because per-user costs are known while services effort, whether done in-house or by an AI automation agency, varies with scope and is better estimated than assumed.
When you are ready to move whole reports rather than single datasets, the same credential and refresh discipline applies to every source. To move paginated reports, plan the SSRS to Power BI migration separately, since paginated report items follow a different path from standard Power BI reports.
If you want a team that has done this many times to plan the move for you, explore our Tableau to Power BI migration services.
---
About Lets Viz: Lets Viz is a data analytics consultancy that has helped teams in healthcare, finance, SaaS, distribution, and professional services build and migrate BI estates since 2020. We hold a 5.0 Clutch rating and work as a practical delivery partner, not a reseller.