Why Do My Power BI Reports Disagree With the General Ledger? A 7-Step Reconciliation
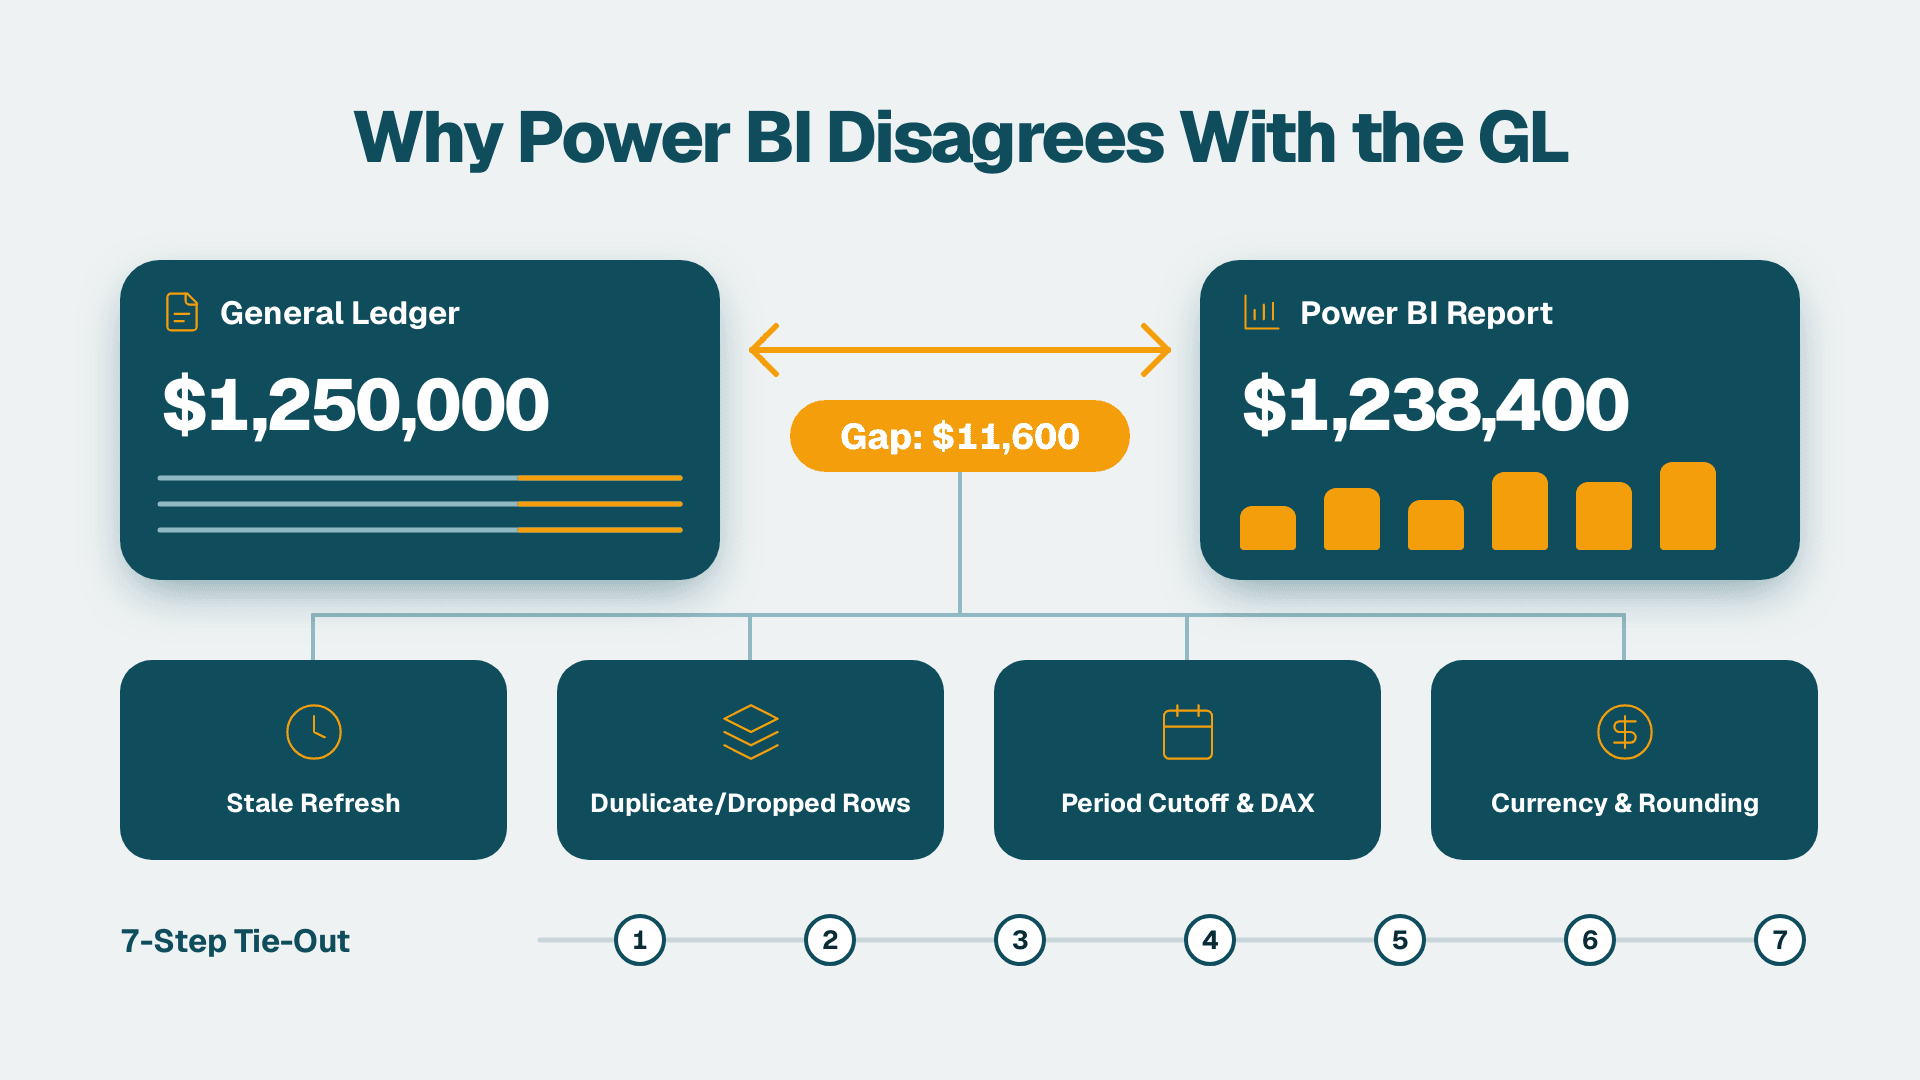
Power BI reports disagree with the general ledger for four main reasons: stale data refreshes, duplicated or dropped rows in the model, filter or DAX logic that differs from GL period rules, and currency or rounding differences. Compare one account, entity and period, classify the gap, then fix the model.
This guide answers "why do my Power BI reports disagree with the general ledger" by walking you through a repeatable tie-out. A first reconciliation usually takes one to two working days, mostly spent pulling GL evidence. Later month-end checks take under an hour.
Key Takeaways
- Classify the gap first. The size and sign of the difference point to refresh lag, a model join problem, filter logic, or rounding before you open a single query.
- Check refresh time against the GL entry-created date. Entries created after the last successful refresh are the most common reason a report trails the ledger.
- Use posting date for period reporting. Entry date moves back-dated accruals into the wrong month.
- Fix the model, not the visual. A manual adjustment measure hides the cause and the gap returns next month.
- Document the tie-out with a preparer and a reviewer. The reconciliation sheet becomes the evidence your auditors ask for.
What Do You Need Before You Start?
You need read access to the GL, edit rights on the Power BI semantic model, and one specific mismatched number. Gather the following before Step 1.
- GL access: read access to your accounting system's trial balance and journal-entry detail reports, with the ability to filter by posting date and by entry date.
- Power BI workspace role: Member or Contributor on the workspace holding the report, so you can open the semantic model, view refresh history, and edit measures. As of 2026, Power BI Pro lists at $14 per user/month and Premium Per User at $24 (Microsoft pricing page, 2026). Pro covers shared content for this exercise.
- Power BI Desktop with a copy of the report file, or permission to download it from the service.
- DAX Studio or the Performance Analyzer pane in Power BI Desktop (optional but helpful for inspecting queries).
- A single mismatched number: one account, one entity, and one period where the report and the GL differ. Write the two values and the difference on a sheet before you start.
- Close calendar: the dates your team locked each period and any reopen dates.
- Audit log access (optional): the Microsoft Purview portal, if your tenant has it enabled.
Step 1: Which Gap Pattern Explains Why Your Power BI Reports Disagree With the General Ledger?
Almost every mismatch falls into one of four buckets, plus a close-cutoff variant of the timing bucket, and the size and sign of the difference tell you which. Classify the gap before changing anything.
1. In your GL, run the Trial Balance report for the single period and entity you picked. Export it to Excel.
2. In Power BI, build a throwaway table visual with the same account, entity, and period. Use the same sign convention as the GL.
3. Compute the difference on your sheet: Report minus GL.
4. Match the pattern using the table below.
| Symptom | Likely Cause | Step to Use | Typical Fix |
|---|---|---|---|
| Difference equals one or more whole journal entries | Stale refresh | Step 2 | Move the refresh after the ERP batch and close adjustments |
| Report is a multiple of the true value | Duplicated rows from a join or duplicate dimension key | Step 3 | Make the dimension key unique and reload |
| Difference equals back-dated entries in a closed month | Close-period cutoff, wrong date column | Step 4 | Relate the date table to posting date |
| Difference appears only when a slicer is applied | Filter context or DAX logic | Step 5 | Correct the measure or the report interactions |
| Tiny differences per line | Currency conversion or rounding | Step 6 | Align the rate type and round after summing |
You should now have a one-line hypothesis, such as 'report is missing a $48,200 accrual posted after the last refresh.' If the gap spans many accounts, start with the largest account by absolute difference and work down.
Step 2: Is Your Power BI Data Stale Compared With the GL?
Often yes. A report is only as current as its last successful refresh, and the GL keeps moving while the semantic model sits still.
1. Open the Power BI service and go to your workspace.
2. Find the semantic model, open the ... menu, and choose Refresh > Refresh history.
3. Note the End time of the last run with status Completed. A Failed row at the top means the dashboard is showing older data than the page header suggests.
4. In your GL, open the journal-entry detail report and filter by entry created date (not posting date) from that refresh end time to now.
5. Add up those entries for your mismatched account.
If the sum equals your difference, the cause is refresh lag. Fix it by moving the scheduled refresh later than your ERP's overnight batch, or by adding a refresh after close adjustments post. Our guide to setting up a Power BI data refresh schedule without breaking reports walks through the schedule settings, including time zone and gateway credentials.
What you should see: after a manual Refresh now, the difference shrinks by exactly the amount you summed. If it does not, move on.
Check the last-refreshed label
Add a card visual showing the maximum of your load timestamp column so readers can see data age on the page itself. A finance report with no visible as-of time invites this exact dispute.
Step 3: Are Duplicated or Dropped Rows Distorting the Model?
If the difference is not time-based, the model may be multiplying or losing rows. Test the model's row counts against the GL.
1. In Power BI Desktop, switch to Model view and look at the relationships between your fact table (GL lines) and dimensions (accounts, entities, dates).
2. Click each relationship line. Confirm Cardinality is **Many to one (*:1) from the fact table to each dimension, and Cross-filter direction is Single** unless you have a documented reason.
3. Switch to Table view, select the fact table, and note the row count in the status bar. Compare it to the GL's line count for the same date range.
4. Open Transform data (Power Query) and check the applied steps on the fact table. Look for a Removed Duplicates step, a Filtered Rows step with a hard-coded date, or an inner join that silently drops lines with no matching account.
5. Create a quick check measure:
```
Row Check = COUNTROWS('GL Lines')
```
If the dimension table holds two rows for the same account code (for example, after an account was renamed), the join will double count. Fix the dimension so each key is unique, then reload.
What you should see: the row count matches the GL, and the measure total for your test account matches to the cent, or the remaining gap is explained by Steps 4 to 6.
Step 4: Are Close-Period Cutoffs Causing the Mismatch?
Very often. This is the most common cause of month-end disagreement for SaaS finance teams, because revenue and deferred revenue entries frequently post after the calendar month ends.
1. Ask your controller for the period lock date and any reopen dates for the month you are testing.
2. In the GL, split your mismatched account's entries into three groups: posted inside the period before the lock, posted inside the period after a reopen, and back-dated entries with a posting date in the period but created later.
3. In Power BI, check which date column your model filters on. In the fact table, look for columns such as Posting Date, Document Date, and Entry Date.
4. Confirm the relationship to your date table is active on Posting Date, which is what the GL uses for period balances.
5. If you must show 'as of close' figures, add a snapshot table or a filter on the entry-created timestamp so later adjustments do not rewrite a closed month.
Here is a hypothetical example: a revenue accrual is created on the 3rd with a posting date of the prior month-end. A report filtered on entry date drops it from the closed month and shows it in the next one, while the GL shows it in the closed month. Switching the active relationship to posting date aligns the two.
What you should see: the closed-period total in Power BI matches the GL trial balance as it stood after the last approved reopen, with every late entry accounted for.
Step 5: Is Filter Context or DAX Logic Changing the Number?
If totals match with no slicers but diverge when a user filters, the problem sits in your DAX or in how slicers interact with your measures.
1. In Power BI Desktop, open Performance Analyzer from the View tab, select Start recording, then change a slicer and click Refresh visuals.
2. Use Copy query on the visual that disagrees, and paste it into DAX Studio, or review the measure definition directly.
3. Look for these patterns in your measures:
- ALL or REMOVEFILTERS on the date table, which ignores the period slicer.
- CALCULATE with a hard-coded entity or account list that has not been updated.
- Year-to-date measures built on a calendar date table when your fiscal year starts in a different month.
- A measure that sums a column for one sign convention, while the GL stores credits as negatives.
4. Check Edit interactions on the report page: a visual set to None will ignore a slicer without any warning.
5. Check row-level security. In the service, open the semantic model's ... menu, then Security, and use Test as role to see whether a role is hiding entities from the viewer.
A good CFO dashboard keeps the number of headline measures small and defines each one once. When deciding what to include in a CFO dashboard, list for each tile its source account range, its sign convention, and its date basis. The pre-launch checklist covers that definition sheet in detail.
What you should see: with the same filters applied, your test visual and the GL trial balance agree to the cent.
Step 6: Do Currency, Rounding, or Eliminations Explain the Remainder?
If you have found no timing, join, or filter issue, small residual differences usually come from conversion and rounding.
1. Check whether your GL reports in transaction currency, functional currency, or reporting currency. Your model must use the same one.
2. Confirm the exchange rate source and the rate type: period-end, average, or historical. The GL typically applies different types to balance sheet and income statement accounts.
3. In Power Query, look for a step that rounds values before they are summed. Rounding each line and then summing gives a different total than summing and then rounding.
4. For consolidated reports, confirm that intercompany eliminations are included in the model. If the GL consolidation posts them as separate entries, a report that reads only entity-level ledgers will not match.
What you should see: any remaining difference is zero or is documented as a known, immaterial rounding amount with a named owner.
Step 7: How Do You Document the Reconciliation as an Audit Trail?
Record the cause, the fix, and who reviewed it, in a form an auditor can follow. Fixing the number is half the job. Your auditors will ask how you know the report is right and who reviewed it. Under US GAAP, your financial statements must be supported by records you can trace to source transactions, so the reconciliation itself becomes evidence.
1. Create a reconciliation sheet with these columns: Period, Entity, Account, GL balance, Power BI balance, Difference, Cause, Fix, Preparer, Reviewer, Date reviewed.
2. Save the GL export and a screenshot or export of the Power BI visual, both timestamped, in your close folder.
3. Record review notes in the same place as the rest of your close package. Each note should state what was questioned, who answered, and how it was resolved. For a deeper approach, see our guide to an AI change log for Power BI reports, which shows how to log model and measure changes.
4. Keep a change record for any measure or query you edited in this exercise, with the before and after definition.
5. If your tenant uses Microsoft Purview, note that Audit (Standard) retains logs for 180 days (Microsoft Purview documentation, 2026). If your auditors need a longer history, export the relevant entries into your close folder before they age out.
6. Have someone other than the preparer sign off on the sheet.
What you should see: a complete package that lets a reviewer pick any reported figure and trace it back to GL entries without asking you a question.
Make it a recurring control
Add a Tie-out page to the report with a table of control accounts, their GL balances loaded from a trial balance export, the Power BI balance, and a difference column with conditional formatting that turns red above your tolerance. Run it before the report is shared each close.
Common Mistakes
- Reconciling to the wrong GL view. Comparing against a report that includes unposted or draft entries creates a false gap. Always use posted balances from the trial balance.
- Fixing the visual instead of the model. Overriding a total with a manual adjustment measure hides the cause and will reappear next month. Correct the join, filter, or date logic, then document it.
- Using entry date for period reporting. This moves back-dated accruals into the wrong month. Use the posting date and an entry-created timestamp only for 'as of' snapshots.
- Ignoring failed refreshes. A refresh failure from an expired gateway credential leaves old data in place. Set up refresh failure notifications on the semantic model under Settings > Refresh.
- Letting reconciliations live in one person's inbox. If only one analyst knows the process, your audit trail breaks when they are away. Store the sheet and evidence in the shared close folder.
Troubleshooting
- Difference changes every time you refresh. The GL is still receiving postings, or the model is reading from a source table that is not locked. Reconcile after the period lock, or point the model at a closed-period extract.
- Report total is exactly double the GL. A duplicate dimension key or a many-to-many relationship is multiplying fact rows. Recheck Step 3 and make the dimension key unique.
- Totals match for one entity but not for others. Row-level security, an entity filter in Power Query, or a missing intercompany elimination is excluding data. Test with Test as role and compare the entity list in the model to the GL.
If your team would rather have a specialist build and monitor this tie-out for you, see our Power BI for SaaS finance teams service.
---
About Lets Viz: Lets Viz is a data analytics consulting firm that has helped finance and operations teams turn their reporting into decisions since 2020. We serve SaaS, professional services, healthcare, distribution, and enterprise clients, and we hold a 5.0 rating on Clutch.