Financial Reporting Software: FP&A vs BI vs ERP Reporting
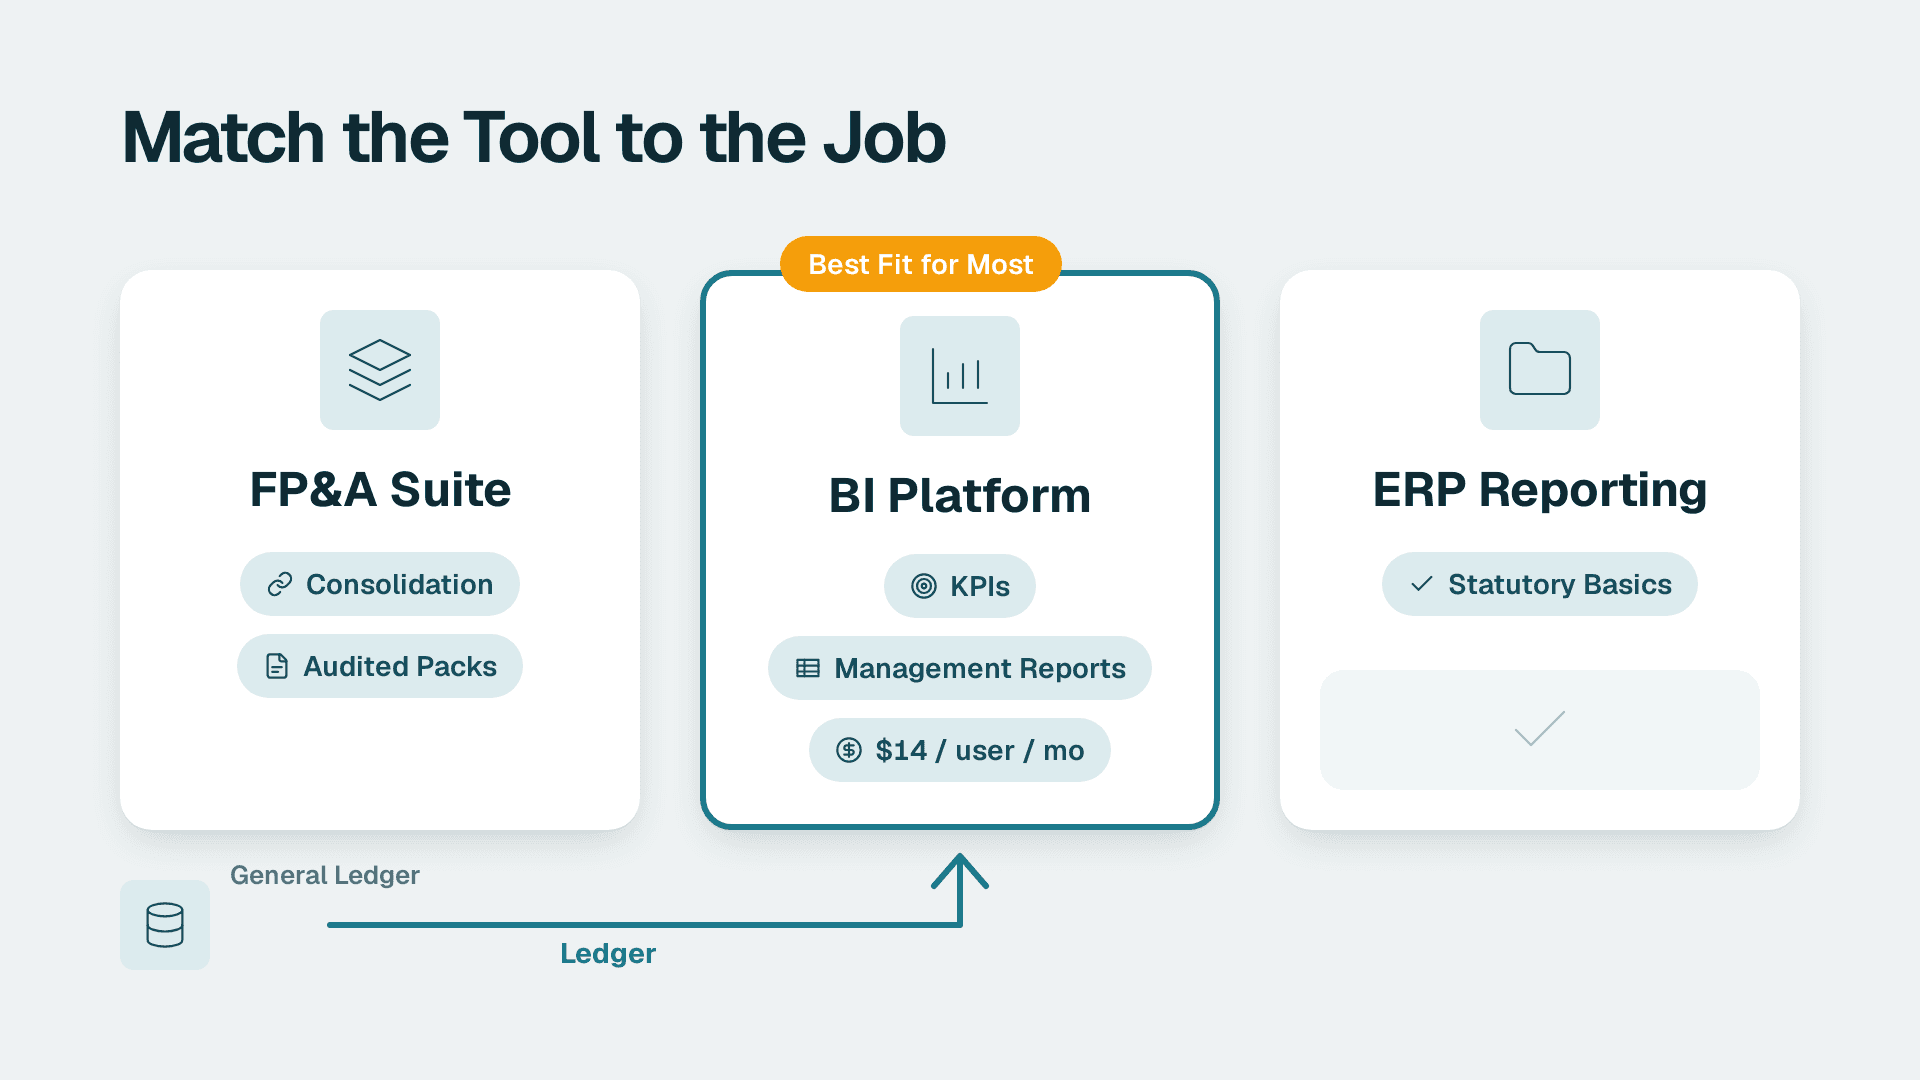
For most SaaS and mid-market finance teams, the best financial reporting software is a BI platform, usually Power BI, sitting on top of your ledger, because it covers management reporting and KPIs at lower licence cost. Choose a dedicated FP&A or consolidation tool when you close multiple entities or file audited statements. Rely on ERP reporting only for statutory basics.
Key Takeaways
- Match the tool to the job: FP&A suites for consolidation and audited packs, BI platforms for management reporting and KPIs, ERP reporting for statutory basics.
- Power BI Pro lists at $14 per user per month and Premium Per User at $24, so licence cost is rarely the deciding factor.
- Implementation effort comes from data modelling and close alignment, not from the software licence.
- Multi-entity consolidation with audited output is the one case where a BI platform alone falls short.
- Most single-entity SaaS finance teams are better served by a BI layer over their ledger than by a heavy FP&A suite.
Quick Comparison: Financial Reporting Software Options at a Glance
The phrase "financial reporting software" covers three very different product types, and most shortlists go wrong by comparing them as if they were the same thing. The table below separates them by the criteria that decide real purchases. If you want the BI route built specifically for subscription businesses, see our Power BI for SaaS finance teams service.
| Criteria | FP&A and consolidation tools | BI platforms (Power BI, Tableau, Zoho Analytics) | ERP built-in reporting |
|---|---|---|---|
| Cost model | Quote-based subscription, usually scoped by modules or entities | Per-user licences; Power BI Pro $14, PPU $24 per user per month | Bundled with the ERP licence; advanced reporting may be extra modules |
| Setup effort | Weeks to a few months, with vendor-led onboarding | Days for a first report, weeks for a governed finance model | Low for standard reports, high for anything custom |
| Best company fit | Multi-entity groups, audited or listed reporting | Single-entity to mid-sized SaaS and enterprise teams wanting flexible KPIs | Companies whose ledger and reporting needs are standard |
| Learning curve | Moderate; finance-friendly and template driven | Steeper for modelling, easy for report consumers | Low for users, high for report changes |
| Scalability | Strong on entities, currencies and consolidation | Strong on data volume and sources, you design the finance logic | Tied to the ERP's data and release cycle |
| Vendor lock-in | High; logic and workflows live in the tool | Medium; data stays in your warehouse, models are portable in concept | High; reports are tied to the ERP schema |
| Audit trail and controls | Built in, often cell-level | Possible, but you design and document it | Strong for ledger transactions |
| KPI and SaaS metric flexibility | Limited to what the tool models | Very high; any source can be joined | Low; operational metrics sit outside the ledger |
How Much Does Financial Reporting Software Cost?
Verdict: BI platforms have the lowest and most transparent licence cost, FP&A suites the least transparent, and ERP reporting looks free until you need to change it.
Power BI list prices have been $14 per user per month for Pro and $24 per user per month for Premium Per User since 1 April 2025. For a finance team of eight to ten report consumers and builders, that is a small line item. Our guide on Power BI Pro vs PPU vs Fabric explains when you outgrow Pro.
One caution on AI features: Copilot in Power BI and Fabric needs a paid Fabric capacity of F2 or higher, or Power BI Premium P1 or higher. A Pro or PPU licence alone is not enough, and trial capacities are excluded. Budget for capacity if you want natural-language questions over your financial model.
Tableau and Zoho Analytics are also sold per user with tiered plans. Check the vendors' current price pages before you build a business case, because plan names and limits change.
FP&A platforms are mostly quote-based. A guide from HighRadius lists ten platforms in this space, including Anaplan, Datarails, Planful, Prophix, Vena and Workday, and none of them publish a single comparable price. Expect pricing to scale with entities, users and modules, and ask for a three-year total cost, not the first-year quote.
ERP reporting is bundled, so it feels free. The cost shows up later, when finance needs a report the standard pack does not provide and the change request joins the IT queue.
The cost that surprises buyers
The licence is the smaller number. The larger one is the work of defining revenue, deferred revenue, ARR and cost allocation once, in one place. That work is the same whichever tool you pick, which is why it belongs in the budget from day one.
SaaS companies also face an accounting question that reporting software has to support: implementation costs for cloud software you buy. The treatment can differ between US GAAP and IFRS, and the same spend may be capitalised under one and expensed under the other. Your reporting layer should tag these costs with a dimension so finance can split capitalised and expensed amounts. Confirm the policy with your auditors before you design the tag.
Which Software for Financial Reporting Fits Your Company Size?
Verdict: complexity, not headcount, decides fit. One legal entity and one currency points to BI; many entities, intercompany eliminations and audited packs point to FP&A.
These are rules of thumb from our project experience, not vendor thresholds.
Early-stage and growth SaaS (one entity, one or two currencies)
Your ledger is probably a cloud accounting package. CloudZero describes QuickBooks, for example, as an all-in-one accounting tool from Intuit with cloud and desktop options. The ledger produces statements; what it does not produce is MRR movement, cohort retention or board-ready variance commentary. A BI layer fills that gap cheaply.
Scaling SaaS (several entities, budget cycles, investor reporting)
This is the contested zone. If the pain is spreadsheets, slow report prep and manual consolidation, an Excel-centric FP&A tool can be a fast fix. The HighRadius guide positions Datarails for teams on Excel-based workflows and Vena for mid-sized, Excel-centric teams that want workflow automation and template-based reporting. If the pain is KPI visibility and self-service, BI wins.
Enterprise (multi-entity, audited, regulated)
Enterprises usually run both: an FP&A or close platform for the official numbers, and a BI platform for the analysis layer that executives actually open. ERP reporting stays as the system of record. Pretending one tool does all three jobs is where large programmes stall.
How Much Implementation Effort Does Each Option Need?
Verdict: ERP reports are quickest to switch on, FP&A tools are quickest to a finished close pack, and BI takes the most design work but gives the most freedom afterwards.
A realistic BI build for finance has four stages:
1. Connect and land the data. Pull the general ledger, billing and CRM data into a warehouse or lakehouse.
2. Model it. Build a star schema with a date table, chart of accounts, entity and customer dimensions.
3. Write the measures. Revenue, ARR, gross margin, variance to budget, all defined once.
4. Govern and publish. Row-level security, refresh schedules and a certified semantic model.
Microsoft Fabric components explained for finance teams
You do not need every Fabric component. Finance teams typically use four: OneLake as the storage layer, pipelines to load ledger and billing data, a lakehouse or warehouse to hold modelled tables, and the Power BI semantic model that report users query. Everything else, such as real-time streaming and data science workloads, is optional. If you already run Power BI, our walkthrough on migrating a Power BI workspace to Microsoft Fabric covers the move.
RANKX DAX finance examples
The measure that finance teams reach for first is ranking. A cost-centre overspend ranking looks like this: `Overspend Rank = RANKX(ALL(CostCentre[Name]), [Variance to Budget])`. The same pattern ranks customers by ARR, products by gross margin or vendors by spend. It is a good test of any BI partner: ask them how they handle ties and filters in ranking measures.
For automating the recurring work, see How to Automate Monthly Financial Reporting in Power BI.
FP&A and ERP effort
FP&A tools shorten the build because templates, consolidation logic and workflow already exist. The effort moves to mapping your chart of accounts and entity structure into the tool. ERP reporting needs the least setup for standard statements, but any custom layout usually means developer time against the ERP schema.
Can Financial Statement Reporting Software Handle Close, Audit Trail and Consolidation?
Verdict: this is where FP&A tools earn their price, and where BI needs deliberate design.
Take Workiva as a reference for what dedicated tools offer. It states that users can link commonly referenced data points to a single source, so when a number changes the updates flow through, with audit trails showing who changed what, when and why. It also states it can limit access down to individual cells, slides or paragraphs by role, and that it automates data pulls from ERP, GL and consolidation systems. Its solution covers annual reports, interim reports, board presentations, investor updates and audited financial statements.
In the same category, Cube's review describes Sage Intacct as offering dimensional tagging for deeper insights and automation for consolidations and audit prep, and Microsoft Dynamics 365 Finance as offering native integrations with Excel and Power BI. That second point matters: ERP and BI are not rivals, since the ERP holds the transactions and BI presents them.
What BI can do on audit trail
A BI platform does not give you a statutory audit trail out of the box. You build it: reconcile report totals to the ledger, version your measures, restrict who can edit the model, and keep an evidence log. On retention, Microsoft Purview Audit (Standard) keeps audit logs for 180 days, so if your auditors need longer evidence of who changed a report, export the logs on a schedule. Our guide on month-end close review notes and audit trail shows a practical pattern.
Drill-down is the practical test
Gravity defines drill-down reporting as letting users move from summarised financial results into the transactions and supporting information behind them. Ask every vendor to demonstrate this live on your data, from a P&L line to the invoice. BI platforms do this well when the model is built for it, and ERP reporting does it natively for ledger data.
Do BI Platforms Handle Alerts, Approvals and SaaS Reporting Templates Better?
Verdict: yes. This is the clearest BI advantage, because BI joins finance data to operational data and can trigger action.
Power BI and Power Automate for finance alerts and approvals
A data alert on a Power BI card, such as cash balance below a threshold or a cost centre more than 10% over budget, can start a Power Automate flow. The flow can post to Teams, email the budget owner or open an approval request for the variance explanation. Check which licence the connectors in your flow require before you promise it to the business. We cover the strengths and limits in Power Automate: What It Does, Limits and When to Get Help.
SaaS finance reporting examples and templates
The reports worth building first for a subscription business are an MRR and ARR bridge (new, expansion, contraction, churn), a gross margin by product view, a cash and runway view, a budget versus actual with commentary, and a billing-to-ledger reconciliation. Templates speed the first draft, but the metric definitions must be yours. Start with How to Build a KPI Dashboard Leadership Actually Uses and the layouts in Financial Dashboard Examples for Better Decision-Making.
What Is Management Reporting and Which Financial Reports Come First?
Verdict: management reporting is the internal, decision-focused layer on top of statutory statements, and it is where BI beats the other two options.
Statutory reporting follows fixed formats. Management reporting answers questions: which segment is growing, where is margin leaking, what does next quarter look like. Cube notes that businesses typically generate three main financial statements: income statements, balance sheets and cash flow statements. Build those first and make them tie to the ledger. Then add the SaaS metrics, variance views and board pack on top.
There is one more signal worth testing. Gravity lists signs that reporting software is holding a business back: heavy reliance on spreadsheets, slow report preparation, limited drill-down, hard-to-change reporting structures, separate processes per audience, disconnected financial and operational analysis, and growing complexity as entities and users are added. If you recognise three or more, your current setup is the problem, not your team.
A note on AI assistants: they can summarise a statement you paste in, but they are not a reporting system. They have no governed definitions, no refresh and no audit trail. AI works best on top of a tested model, which is why we suggest running a readiness check first, such as our free BI readiness self-assessment.
When to Choose an FP&A or Consolidation Tool
- You close three or more legal entities with intercompany eliminations and multiple currencies.
- Your auditors or regulators expect cell-level change history and locked reporting periods.
- You publish annual reports, board packs or investor updates with narrative that must tie to the numbers.
- Your finance team lives in Excel, has no BI skills, and needs templates and workflow within weeks.
- You are a listed or pre-IPO company where controls over the reporting process are scrutinised.
When to Choose a BI Platform
- You are a single-entity or two-entity SaaS company that needs MRR, ARR, retention and margin alongside the P&L.
- You want one model joining ledger, billing, CRM and payroll data, with drill-down from summary to transaction.
- You already use Microsoft 365, so Power BI is a natural fit; Zoho Analytics suits teams already on Zoho Books or Zoho CRM; Tableau suits teams with strong analyst skills and visual exploration needs.
- You want alerts and approvals triggered by the data rather than a monthly spreadsheet chase.
- You can fund a proper data model once and then change reports without a vendor ticket.
The Verdict
For most CFOs and finance directors at SaaS and mid-market companies, a BI platform on top of the ledger is the right financial reporting software. Power BI is our default recommendation: the licence is low ($14 per user per month for Pro), the model is portable, and it connects to almost every finance and billing system. Keep ERP reporting for statutory outputs and treat it as the source of truth, not the presentation layer.
The non-winner is still the better call in one scenario: multi-entity consolidation with audited output. If you close many entities and your auditors want cell-level controls, buy the FP&A tool for the official numbers, then add BI for the analysis layer. Do not try to rebuild consolidation logic in a dashboard tool.
Ready to scope a build? Talk to us about Power BI for SaaS finance teams, or size the project first with our instant project cost calculator.
Sources
- Workiva: annual and interim financial reporting
- HighRadius: best financial reporting tools
- CloudZero: financial reporting tools
- Cube: best financial reporting software
- Gravity: financial reporting software
Facts and prices checked November 2026.
---
About Lets Viz: Lets Viz is a data analytics consulting firm that has delivered Power BI, Tableau and Zoho Analytics projects since 2020 for SaaS, finance, healthcare and enterprise teams. We hold a 5.0 Clutch rating and specialise in governed finance data models, KPI reporting and month-end automation.