Best Financial Reporting Examples: 7 Packs Ranked for SaaS
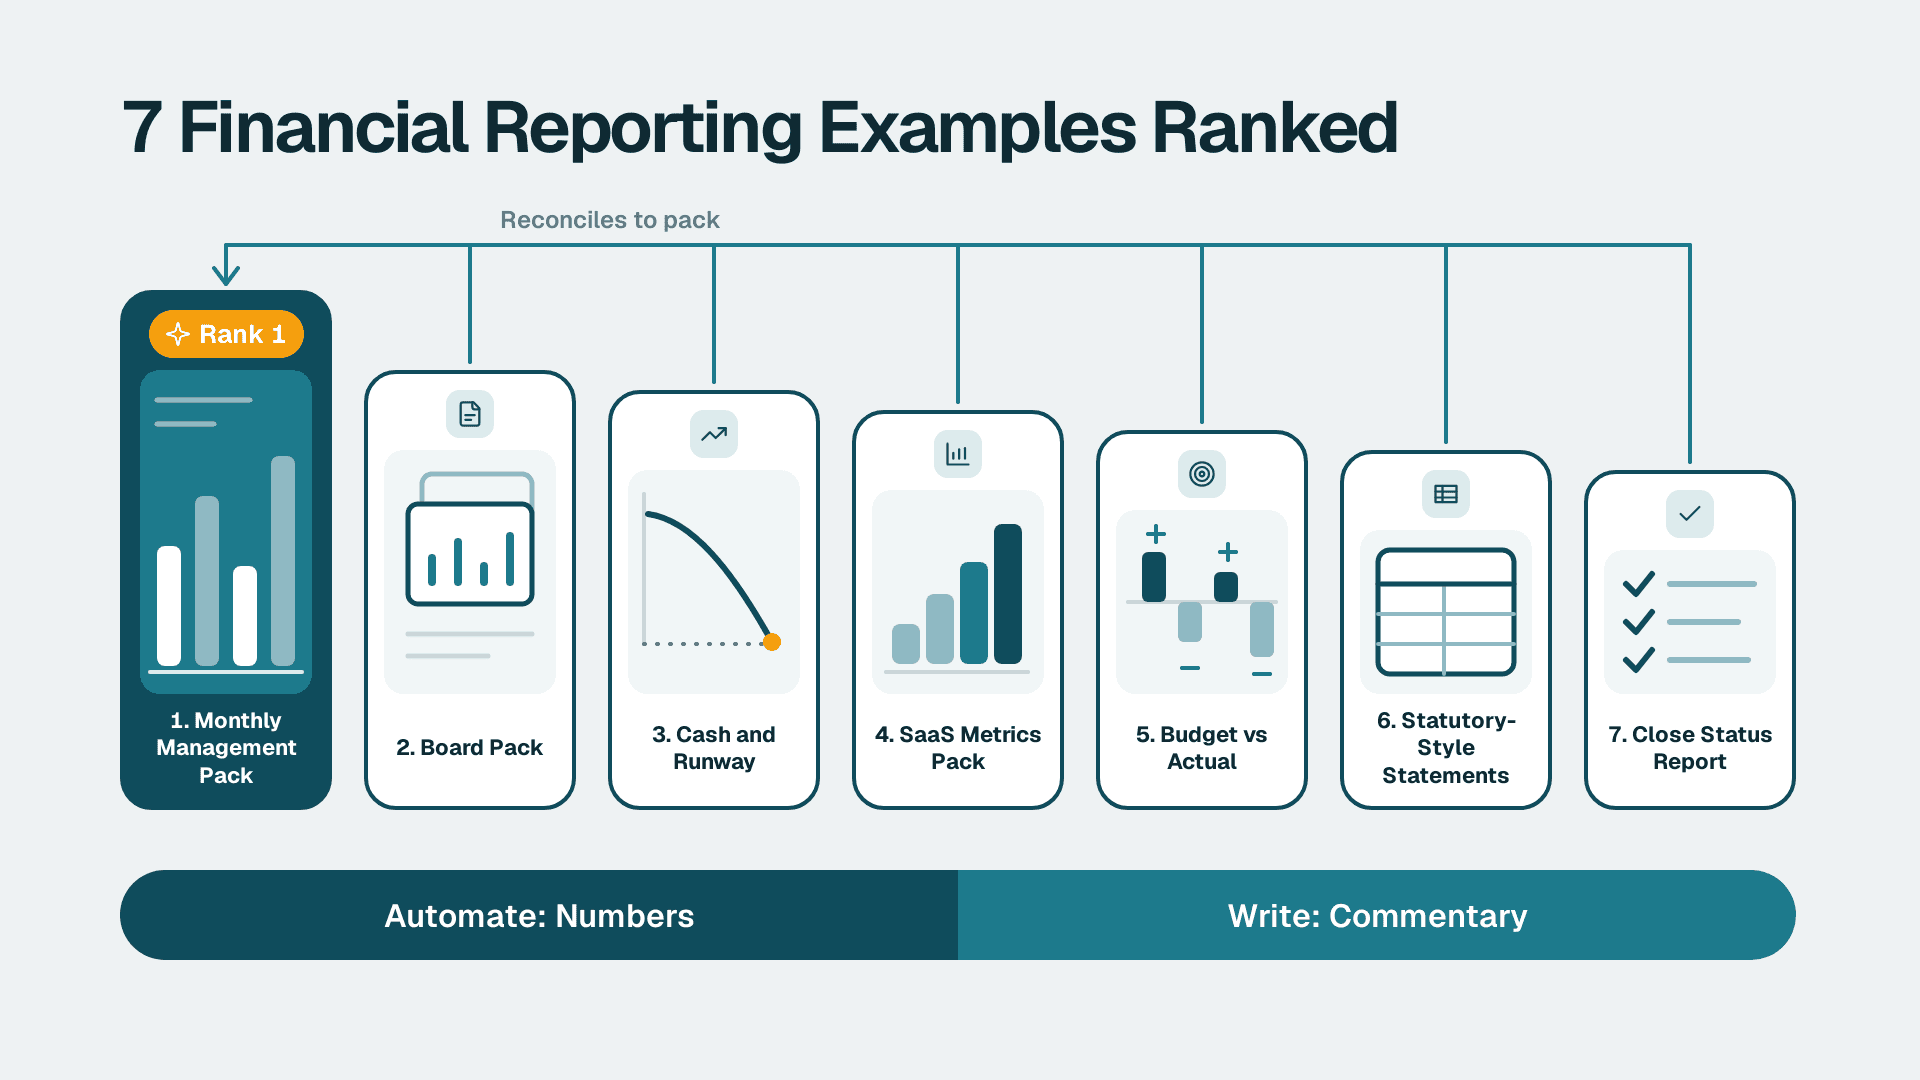
The best financial reporting example for a SaaS finance team is the monthly management pack: one consistent document that ties the P&L, balance sheet, cash and SaaS metrics to a single page of commentary. Rank it first, then layer a board pack, a cash and runway view and a SaaS metrics pack on top. Automate the data, keep the commentary human.
Key Takeaways
- The monthly management pack is the foundation; every other report should reconcile back to it.
- Good examples of financial reporting separate numbers (automate) from judgement (write by hand).
- Cash and runway plus SaaS metrics are the two views investors and boards ask about most.
- A pack that disagrees with the general ledger loses trust fast, so reconciliation comes before design.
- If you want these built and maintained for you, see our Power BI for SaaS finance teams service.
Our Ranking Criteria
We ranked each reporting example on what a finance head benchmarking their own pack actually cares about:
- Decision value: does the report change what the CFO, board or budget holders do next month?
- Audience fit: is it readable by the person who receives it without a walkthrough?
- Automation potential: how much of the data assembly can run without manual copy and paste?
- Reconciliation integrity: does every number tie back to the ledger, and can you prove it?
- Effort to maintain: how much monthly time does it take once it is built?
This list is opinionated. It is based on how SaaS and enterprise finance teams typically structure reporting, not on any single client engagement. Where we show a layout, it is a hypothetical illustration, not a client result.
1. Monthly Management Pack: The Backbone of Every Reporting Cycle
The monthly management pack is the internal document the finance team issues after close. It usually opens with a one-page summary, then moves through the P&L against budget and prior period, the balance sheet, cash, headcount and key operating metrics.
What good looks like: a single summary page with five to eight headline numbers, a variance table where each material line carries a short written explanation, and drill-through to detail. The commentary says why, not just what moved.
What to automate: the data pull from the ledger, the budget comparison, the variance calculations and the page layout. A semantic model with consistent measures means the same revenue figure appears everywhere. Our guide on how to automate monthly financial reporting in Power BI walks through the pattern.
Best for: CFOs, finance directors and FP&A leads at SaaS and enterprise companies who issue a pack every month.
Pros:
- One source of truth that every other report can reconcile to
- Variance commentary builds trust with budget holders
- Highest return on automation effort
Cons:
- Bloats quickly if every stakeholder request adds a page
- Only as credible as the underlying close process
2. Board Pack: Short, Decision-Led and Consistent
The board pack is the management pack compressed for non-executives. It leads with the decisions or risks that need attention, then a small set of financial statements, a KPI scorecard, cash position and forward outlook.
What good looks like: ten to fifteen pages, the same order every quarter, trend lines instead of single points, and appendices for detail so the main body stays short. Published examples of internally prepared statements typically pair a balance sheet and a statement of operations with a record of board approval, which is a useful reminder that the board pack is also a governance document, per examples of internally prepared financial statements.
What to automate: the KPI scorecard, the trend charts and the period-over-period comparisons. Keep the narrative and the risk discussion manual. See financial dashboard examples for better decision-making for layouts that work.
Best for: CFOs and founders who report to a board or investors on a fixed cycle.
Pros:
- Forces prioritisation of what matters
- Consistent structure makes trends obvious
- Can reuse the management pack data model
Cons:
- Easy to overload with detail the board will not read
- Narrative takes real time and cannot be automated well
3. Cash and Runway Report: The One Investors Ask For First
The cash and runway report shows current cash, a forward cash forecast, burn and the months of runway remaining under a base case and a downside case. It bridges the cash flow statement to a forward view.
What good looks like: a weekly or monthly cash bridge from opening to closing cash split into operating, investing and financing activities, a rolling forecast, and clearly stated assumptions for collections timing and hiring. It names the scenario behind each runway number so nobody quotes the wrong one.
What to automate: the actuals, the receivables ageing feed and the scenario toggles. The assumptions themselves stay with finance. Power BI and Power Automate can also send alerts or route approvals when cash falls below a threshold; our overview of Power Automate, its limits and when to get help covers what that involves.
Best for: SaaS finance leads at growth-stage companies and any business managing tight liquidity.
Pros:
- Directly answers the question every investor and lender asks
- Scenario views support faster decisions
- Alerts catch problems before the month-end pack does
Cons:
- A forecast is only as good as the collections and hiring assumptions
- Needs clean receivables data to be credible
4. SaaS Metrics Pack: ARR, Retention and Unit Economics
This is the SaaS-specific layer: annual recurring revenue and its movements (new, expansion, contraction, churn), net and gross revenue retention, customer acquisition cost, payback and cohort views.
What good looks like: metric definitions written down once and applied everywhere, an ARR bridge that reconciles to recognised revenue, and cohort retention charts rather than a single blended churn number. Customer rankings, such as top accounts by ARR, are a natural use of DAX ranking functions like RANKX, so the top-N list updates with filters instead of being rebuilt by hand.
What to automate: almost all of it. Subscription and billing data feeds a model, and the metrics are measures that refresh on schedule. This is where a proper data foundation, including the lakehouse and semantic model components of Microsoft Fabric, starts to pay off for finance teams that outgrow spreadsheets. If you need a layout reference, see our KPI dashboard guide for leadership.
Best for: SaaS CFOs and FP&A teams reporting recurring revenue to a board or investors.
Pros:
- Speaks the language investors expect
- Highly automatable once definitions are fixed
- Exposes retention problems early
Cons:
- Definition drift between finance, sales and product undermines trust
- Needs billing and ledger data reconciled first
5. Budget vs Actual Variance Report: Where Budget Holders Engage
This report compares actual spend and revenue to budget or forecast by department, cost centre or product line, with a written explanation for material variances.
What good looks like: variances ranked by size so the reader sees the biggest movers first, a clear materiality threshold, and a split between timing differences and permanent ones.
What to automate: the comparison, the ranking and the threshold flags. The explanation stays with the budget owner.
Best for: FP&A teams and department heads who own a budget.
Pros:
- Drives accountability at department level
- Simple to build once the chart of accounts is mapped
Cons:
- Poor cost-centre mapping makes the numbers contested
- Becomes noise if every small variance needs a comment
6. Statutory-Style Financial Statements Pack: The Compliance Baseline
A complete financial report includes a balance sheet, an income statement, a cash flow statement, a statement of changes in equity, notes and management's discussion and analysis, according to a payments platform's guide to financial reports. It also notes that US businesses must file periodic reports with the SEC.
What good looks like: statements that are understandable, relevant, reliable and comparable, as described in the overview of financial statements. Notes explain accounting policies clearly. For SaaS companies, one policy worth flagging is how implementation costs of cloud software are treated, since the accounting treatment differs between US GAAP and IFRS. Confirm your policy with your auditors rather than assuming.
What to automate: the trial balance mapping, the statement generation and the comparatives. Notes and MD&A remain written work.
Best for: finance directors preparing year-end, lender or audit packs. Our pillar guide to financial reporting statements and Power BI setup covers the statements in depth.
Pros:
- Required for audit and external stakeholders
- A clean mapping here improves every other report
Cons:
- Backward-looking, so weak for steering the business
- Notes and policy disclosures are slow to prepare
7. Close and Reconciliation Status Report: The Unglamorous Safeguard
This internal report tracks close tasks, open reconciling items, review notes and sign-offs. It rarely leaves finance, but it explains why the other six reports can be trusted.
What good looks like: a checklist view with owner, status and due date, plus a list of unreconciled differences between sub-ledgers, reports and the general ledger. If a dashboard total disagrees with the ledger, the 7-step reconciliation is the place to start.
What to automate: status roll-ups, reminders and difference calculations.
Best for: controllers and finance managers running a repeatable month-end.
Pros:
- Catches errors before they reach the board
- Creates an audit trail for review notes
Cons:
- Little visible glamour, so it is the first thing cut under pressure
Quick Comparison Table
| Reporting example | Main audience | Cadence | Automation potential | Maintenance effort |
|---|---|---|---|---|
| 1. Monthly management pack | CFO, budget holders | Monthly | High | Medium |
| 2. Board pack | Board, investors | Quarterly or monthly | Medium | Medium |
| 3. Cash and runway report | CFO, investors, lenders | Weekly or monthly | High | Medium |
| 4. SaaS metrics pack | CFO, board | Monthly | High | Low |
| 5. Budget vs actual variance | Department heads | Monthly | High | Low |
| 6. Statutory-style statements | Auditors, lenders | Annual or quarterly | Medium | High |
| 7. Close and reconciliation status | Controller, finance team | Monthly | Medium | Low |
How to Choose
- Starting from spreadsheets? Build the monthly management pack first. Everything else reuses its data model.
- Reporting to investors or a board? Add the cash and runway report and the SaaS metrics pack next.
- Budget holders ignore your numbers? Fix the variance report and the cost-centre mapping before adding visuals.
- Numbers keep disagreeing with the ledger? Put the close and reconciliation report ahead of any new dashboard.
- Licensing question? Power BI Pro is $14 per user per month and Premium Per User is $24 per user per month. Our licence comparison explains which tier fits, and Copilot features need a paid Fabric capacity F2 or higher or Power BI Premium P1 or higher, not a Pro or PPU licence alone.
How Many Types of Financial Reports Are There?
There is no single fixed number, but most finance teams work with two families. The first is the four basic statements: balance sheet, income statement, statement of changes in equity and cash flow statement, usually accompanied by management's discussion and analysis. The second is management reporting: the monthly pack, board pack, cash and runway, SaaS metrics and variance reports above. A balance sheet is a snapshot in time, while the other statements cover activity over a period.
What to Put in a Financial Reporting Sample
A useful financial reporting sample or example of financial reporting follows a simple order: a summary page, the P&L against budget and prior period, the balance sheet, cash, key operating metrics, then commentary. In the examples of financial reporting we see work best, every number ties back to the ledger and every page answers one question.
What Is the Difference Between Profit and Loss?
Profit and loss are the two possible outcomes of the same calculation: revenue minus costs. A positive result is profit and a negative result is a loss. The P&L statement is the report that shows how you got there.
What Should You Automate in Financial Reporting Examples?
Automate data assembly, reconciliation checks, variance calculation, ranking, refresh and distribution. Keep commentary, assumptions, scenario choices and accounting policy decisions with people. Cleaning source data first, for example with Power Query before modelling, usually saves more time than any visual redesign.
If you want a reporting pack that refreshes itself and reconciles to your ledger, explore our Power BI for SaaS finance teams service.
Sources
- What is a financial report and how to create one
- Financial statement overview
- Examples of internally prepared financial statements
Facts and prices checked November 2026.
---
About Lets Viz: Lets Viz is a data analytics consultancy that has delivered Power BI, finance reporting and automation work since 2020 for SaaS, healthcare, retail and enterprise teams. We hold a 5.0 Clutch rating, and we build reporting packs that reconcile to the ledger and stay maintainable.