Financial Reporting Consolidation: Entities, Currencies, Cost
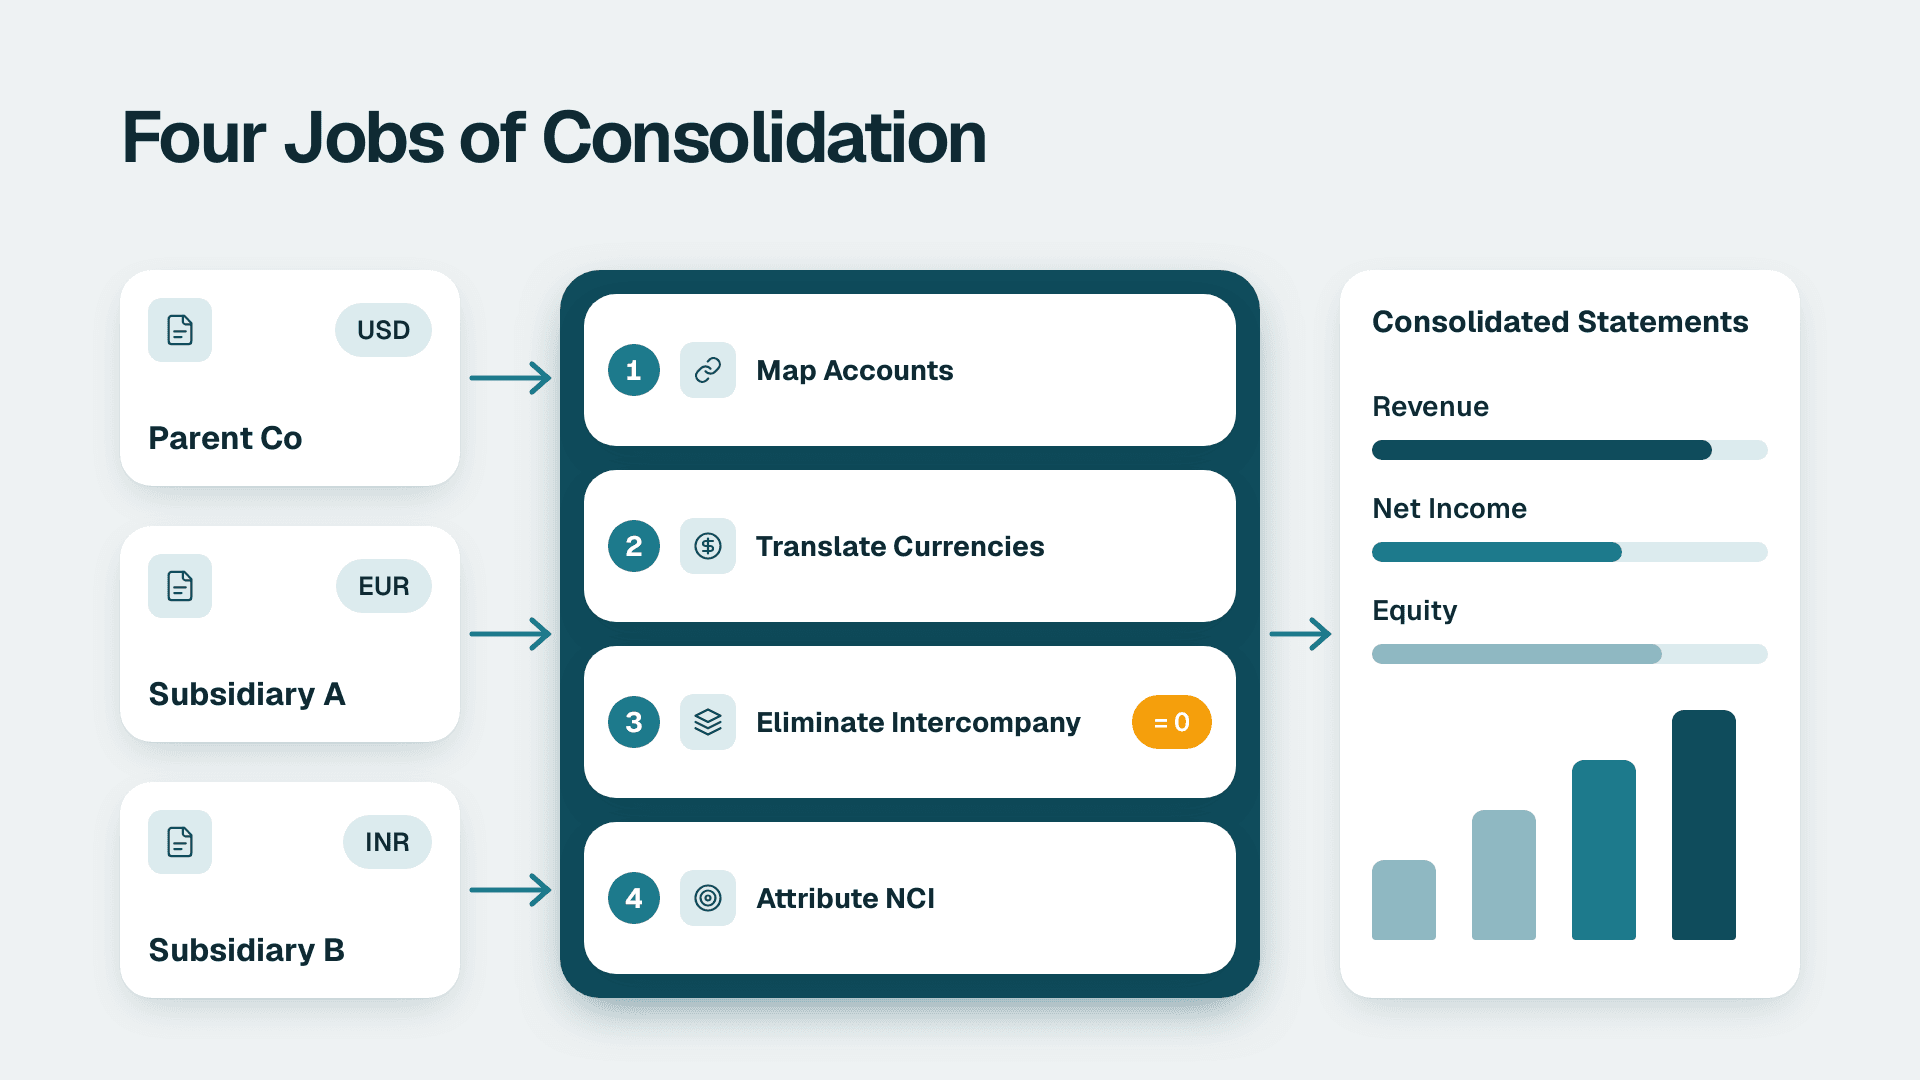
Financial reporting consolidation combines the results of a parent and its subsidiaries into one set of statements, as if the group were a single economic entity. The work has four parts: aligning charts of accounts, translating currencies, eliminating intercompany balances, and calculating non-controlling interest. Power BI can handle this for simpler groups, while complex structures often add a dedicated consolidation tool.
Key Takeaways
- Consolidation is four jobs: map accounts, translate currencies, eliminate intercompany activity, and attribute non-controlling interest.
- Intercompany eliminations are where manual processes fail first, because mismatched entries between entities never net to zero on their own.
- A star-schema model with entity, account, period, currency and scenario keys beats stacking spreadsheets.
- Power BI suits reporting and review for simpler structures; dedicated tools earn their place when ownership, audit trail and statutory needs get complex.
- Licences are the small part of the cost. Mapping, rate feeds, testing and monthly run time are the large part.
What is financial reporting consolidation?
Financial reporting consolidation is the process of combining the financial statements of a parent and the entities it controls into a single set of group statements. Under IFRS, IFRS 10 requires a parent that controls one or more subsidiaries to present consolidated financial statements, and it makes control the basis for consolidation. The statements present assets, liabilities, equity, income, expenses and cash flows of the parent and its subsidiaries as those of a single economic entity. US GAAP reaches a similar result through its own consolidation guidance, ASC 810, though the control tests differ in detail.
For a finance lead, the definition matters less than the mechanics. A standard reference such as this overview of what a consolidated financial statement is will tell you the output looks like one set of statements. What it does not tell you is that the group has several ledgers, possibly several charts of accounts, several currencies and several close calendars, and someone has to reconcile them every month.
Consider a hypothetical US SaaS company with a UK subsidiary that sells to European customers and a Canadian subsidiary that runs engineering. Each entity keeps its own books in its local currency. The parent needs one view of revenue, margin and cash. That view only exists once the three ledgers are mapped to a common structure, translated and cleaned of internal trading.
If you already report through a Power BI for SaaS finance teams setup, the natural place to start is the model layer, where entity, account and currency become shared dimensions. If you need the basics first, our guide to financial statements, types and Power BI setup covers the statements themselves before you add multiple entities.
What is the difference between consolidated and combined financial statements?
Consolidated statements are built on a parent-subsidiary control relationship, while combined statements aggregate entities that are under common control or management but may not sit in a parent chain. In practice the difference shows up in how ownership percentages are treated.
PwC's guidance on combined statements illustrates this. In its example, combined financial statements of Company A and Company B would reflect 100% of Company B, with no accounting for the 20% not owned by Parent Company. In the same example, the 10% of Company C not owned by Company B would be reflected as a noncontrolling interest. The point for a finance team is that the entity list and ownership percentages drive the presentation, so they belong in your data model as maintained reference data, not as notes in a spreadsheet.
What does "consolidating" mean, and how does it differ from consolidated?
A consolidated statement is the finished group result. A consolidating statement is the working schedule behind it, with a column for each entity, a column for eliminations and adjustments, and a total column. Auditors and controllers like consolidating views because they show where each number came from. In a BI tool, the equivalent is a matrix with entities across the top and an elimination column that you can drill into.
How is non-controlling interest handled?
When a parent controls a subsidiary but owns less than 100%, the group still reports 100% of the subsidiary's assets, liabilities, income and expenses. The share belonging to outside owners is shown separately as non-controlling interest. Your model therefore needs an ownership percentage per entity and period, because ownership can change mid-year after a share purchase or a funding round.
How do intercompany eliminations work?
Intercompany eliminations remove transactions and balances between entities in the same group, so the consolidated statements show only dealings with outside parties. If a UK subsidiary invoices its US parent for engineering services, that revenue and the matching expense are real in each ledger but cancel out for the group.
The common elimination types are below.
| Intercompany item | Example | What you eliminate |
|---|---|---|
| Sales and purchases | Subsidiary bills parent for services | Revenue in one entity against expense in the other |
| Loans | Parent funds a subsidiary | Loan receivable against loan payable, plus interest income and expense |
| Management fees and recharges | Shared-service charge to each entity | Fee income against fee expense |
| Unrealised profit in inventory | Goods sold within the group and still unsold | Profit embedded in closing inventory |
| Investment in subsidiary | Parent's investment on its balance sheet | Investment against the subsidiary's equity |
The elimination itself is simple arithmetic. The difficulty is that the two sides rarely match. One entity books an invoice on the 30th and the other books it on the 2nd. One records the amount in its local currency and the other in the group currency, so exchange rates create a residual. One coder tags the charge to the wrong counterparty.
A workable process has three parts:
1. Tag every intercompany line with a counterparty entity code at the ledger level, so matching does not rely on descriptions.
2. Match and agree balances between entities before the close deadline, with a rule for tolerances.
3. Post eliminations to a dedicated elimination entity, never by editing source ledgers, so the audit trail stays intact.
Unmatched differences should land in a visible suspense line that someone owns and clears. A suspense balance that grows quietly is the clearest sign your consolidation is leaking.
How do you handle multiple currencies in consolidated financial reporting?
You translate each entity's results from its functional currency into the group's presentation currency, using closing rates for the balance sheet and average rates for the income statement, and park the difference in equity. IFRS covers this in IAS 21 and US GAAP in ASC 830, so the approach is familiar to auditors in all three of our target markets.
In a typical setup:
- Assets and liabilities are translated at the closing rate on the balance sheet date.
- Income and expenses are translated at an average rate for the period, or at transaction-date rates where practical.
- Equity items usually use historical rates.
- The resulting difference is held in a translation reserve (often called the cumulative translation adjustment) within equity.
For the data model, the lesson is to store the local currency amount, the rate used, the rate type and the translated amount as separate fields. If you only keep the translated number, you can never explain a movement or restate when a rate is corrected. Keep one governed rate table with a single named source and a clear owner, because two analysts pulling rates from different places is a classic cause of a group balance sheet that will not balance.
A Canadian entity with US dollar customer contracts and a Canadian dollar cost base is a good test case. Its functional currency judgment affects whether foreign exchange differences hit the income statement or the translation reserve, so that decision should be documented and agreed with your auditor before you build logic around it.
Which data model works best for multi-entity consolidation?
For most groups, a star schema with a single general-ledger fact table and shared dimensions for entity, account, period, currency and scenario is the most reliable option. It keeps one definition of each measure and makes eliminations a matter of data, not of formula tricks.
| Model option | Best for | Strength | Weak spot |
|---|---|---|---|
| Stacked spreadsheets | Two or three entities, one-off analysis | Fast to start, familiar | Breaks silently, no audit trail, version chaos |
| Star schema in a Power BI semantic model | Groups wanting one governed reporting layer | Flexible, drillable, cheap to extend | Rules live in DAX and Power Query, so design discipline matters |
| Warehouse or lakehouse layer feeding Power BI | Larger volumes, several source systems | Heavy logic runs upstream and is testable | More components to run and own |
| Ledger inside a dedicated consolidation tool | Complex ownership and statutory needs | Built-in elimination and ownership logic | Another system to license, integrate and maintain |
A practical star schema has these pieces:
- Fact table: one row per entity, account, period, currency and scenario, with local amount, rate and translated amount.
- Entity dimension: legal entity, country, functional currency, parent, ownership percentage and consolidation method.
- Account dimension: the local account mapped to a single group chart of accounts, with statement line and sign convention.
- Elimination entity: a dedicated entity code that holds elimination postings, so they can be shown or hidden in the same visual.
- Scenario dimension: actual, budget and forecast, so variance reporting uses the same structure.
Mapping is where most of the effort goes. Each subsidiary's local chart has to be mapped to the group chart, and new accounts appear without warning. Build a check that flags any unmapped account with a non-zero balance, and clean source files in Power Query before they reach the model. Our walkthrough on using Power Query to clean data before modeling covers the patterns that matter here.
Once the model is sound, DAX handles the presentation: the RANKX function can rank entities by contribution to group revenue or margin, and time-intelligence measures give you year-to-date and prior-period comparisons across the whole group. For teams that outgrow a single semantic model, Microsoft Fabric adds warehouse and lakehouse items where heavier transformation can run before Power BI reads the result.
Power BI vs dedicated consolidation tools: which should you choose?
Choose Power BI when your structure is modest, ownership is mostly 100%, you report under one accounting framework and your main need is flexible analysis. Choose a dedicated consolidation tool when you have frequent ownership changes, several accounting frameworks, strict statutory deadlines or auditors who expect built-in workflow and sign-off.
| Requirement | Power BI semantic model | Dedicated consolidation tool |
|---|---|---|
| Drill-down and KPI reporting | Strong, a core strength | Usually available, often less flexible |
| Elimination rules | Possible through modelled data and measures; you design and maintain them | Typically a built-in rules engine |
| Partial ownership and changes in ownership | Manual reference data and careful measures | Usually built in |
| Audit trail and sign-off workflow | You assemble it with controls and process | Typically a core feature |
| Multiple GAAP or statutory outputs | Hard to do well | A common reason to buy |
| Speed to first report | Quick if your data is clean | Depends on implementation scope |
Many groups end up with a hybrid. The consolidation tool or the ledger produces the official numbers, and Power BI presents them alongside operational and SaaS metrics such as ARR, churn and cash runway, which dedicated tools rarely cover well. The decision is less about which tool is better and more about where the system of record for eliminations and ownership will live.
Compliance should shape the architecture too. A US group with SOC 2 commitments needs access controls and change logging over finance data. A UK or EU group must keep GDPR in mind where entity data includes personal information, such as payroll lines or named customer contracts. A Canadian entity handling personal information falls under PIPEDA. Row-level security in the semantic model and a clear log of who changed mapping tables are the practical controls.
How much does consolidated financial reporting cost?
The licence line is the smallest part of the cost of consolidated financial reporting. On the Power BI side, Microsoft lists Power BI Pro at $14 per user per month and Premium Per User at $24 per user per month (list prices since 1 April 2025). Consider a hypothetical team of six people who build and review the reports. On Pro that is $84 per month in licences, or $144 on Premium Per User, before any capacity charges. Which tier fits depends on model size, refresh needs and how many people consume reports, and our comparison of Power BI Pro, PPU and Fabric licences walks through the choice.
Dedicated consolidation tools are typically quoted per project and per scope, so any number here would be a guess. Ask vendors to price the full scope: entities, users, integrations, implementation and support. Then add the costs that appear in every approach:
- Design and mapping: agreeing the group chart of accounts and mapping each entity to it.
- Integrations: connectors or exports from each ledger, which break when source systems change.
- Rate management: a governed source and process for exchange rates.
- Testing: parallel runs against the existing spreadsheet process until the numbers tie.
- Run cost: the monthly hours your team spends chasing mismatches, which a good design cuts and a poor one multiplies.
If you are scoping a build, the instant project cost calculator gives a first estimate, and the main trade-off is simple. A lighter Power BI build costs less upfront but puts more rule maintenance on your team. A dedicated tool shifts that burden to software at a higher fixed cost.
How do you build a consolidation process that holds up at every close?
A consolidation that holds up has a fixed sequence, automated checks and named owners. Start with the sequence: lock each entity's ledger, load trial balances, map accounts, translate currencies, match and post eliminations, calculate non-controlling interest, then review and sign off.
Build controls into each stage, so problems surface before the CFO sees a dashboard:
1. Trial balance tie-out: each entity's loaded balance equals its ledger.
2. Unmapped account check: no balance sits in an account without a group mapping.
3. Elimination check: intercompany receivables and payables net to zero, with differences listed.
4. Balance check: the consolidated balance sheet balances after translation.
5. Movement review: large changes against the prior period are explained before release.
Automation removes the repetitive work. Our guide on automating monthly financial reporting in Power BI shows how scheduled refreshes and checks reduce manual rework, and the financial dashboard examples article shows what finished group views can look like.
The same discipline applies across markets. A UK fintech group closing under IFRS and a Canadian manufacturing company with a US subsidiary face different local rules but the same operational problem: several ledgers, one deadline, and a board that wants a single set of numbers. Start with the two or three entities that carry most of the intercompany volume, prove the process there, and add the rest once the checks pass without manual fixes.
Power BI for SaaS finance teams - see how a governed consolidation model, elimination logic and group reporting layer can be built for multi-entity SaaS finance.
---
About Lets Viz: Lets Viz is a data analytics consulting firm that has built Power BI and finance reporting solutions since 2020 for clients across US healthcare, UK fintech, Canadian manufacturing and global SaaS. We hold a 5.0 Clutch rating and focus on reporting models that finance teams can maintain and auditors can follow.
Sources
Facts and prices checked November 2026.