Power BI Semantic Model: What It Is and Why One Beats Many
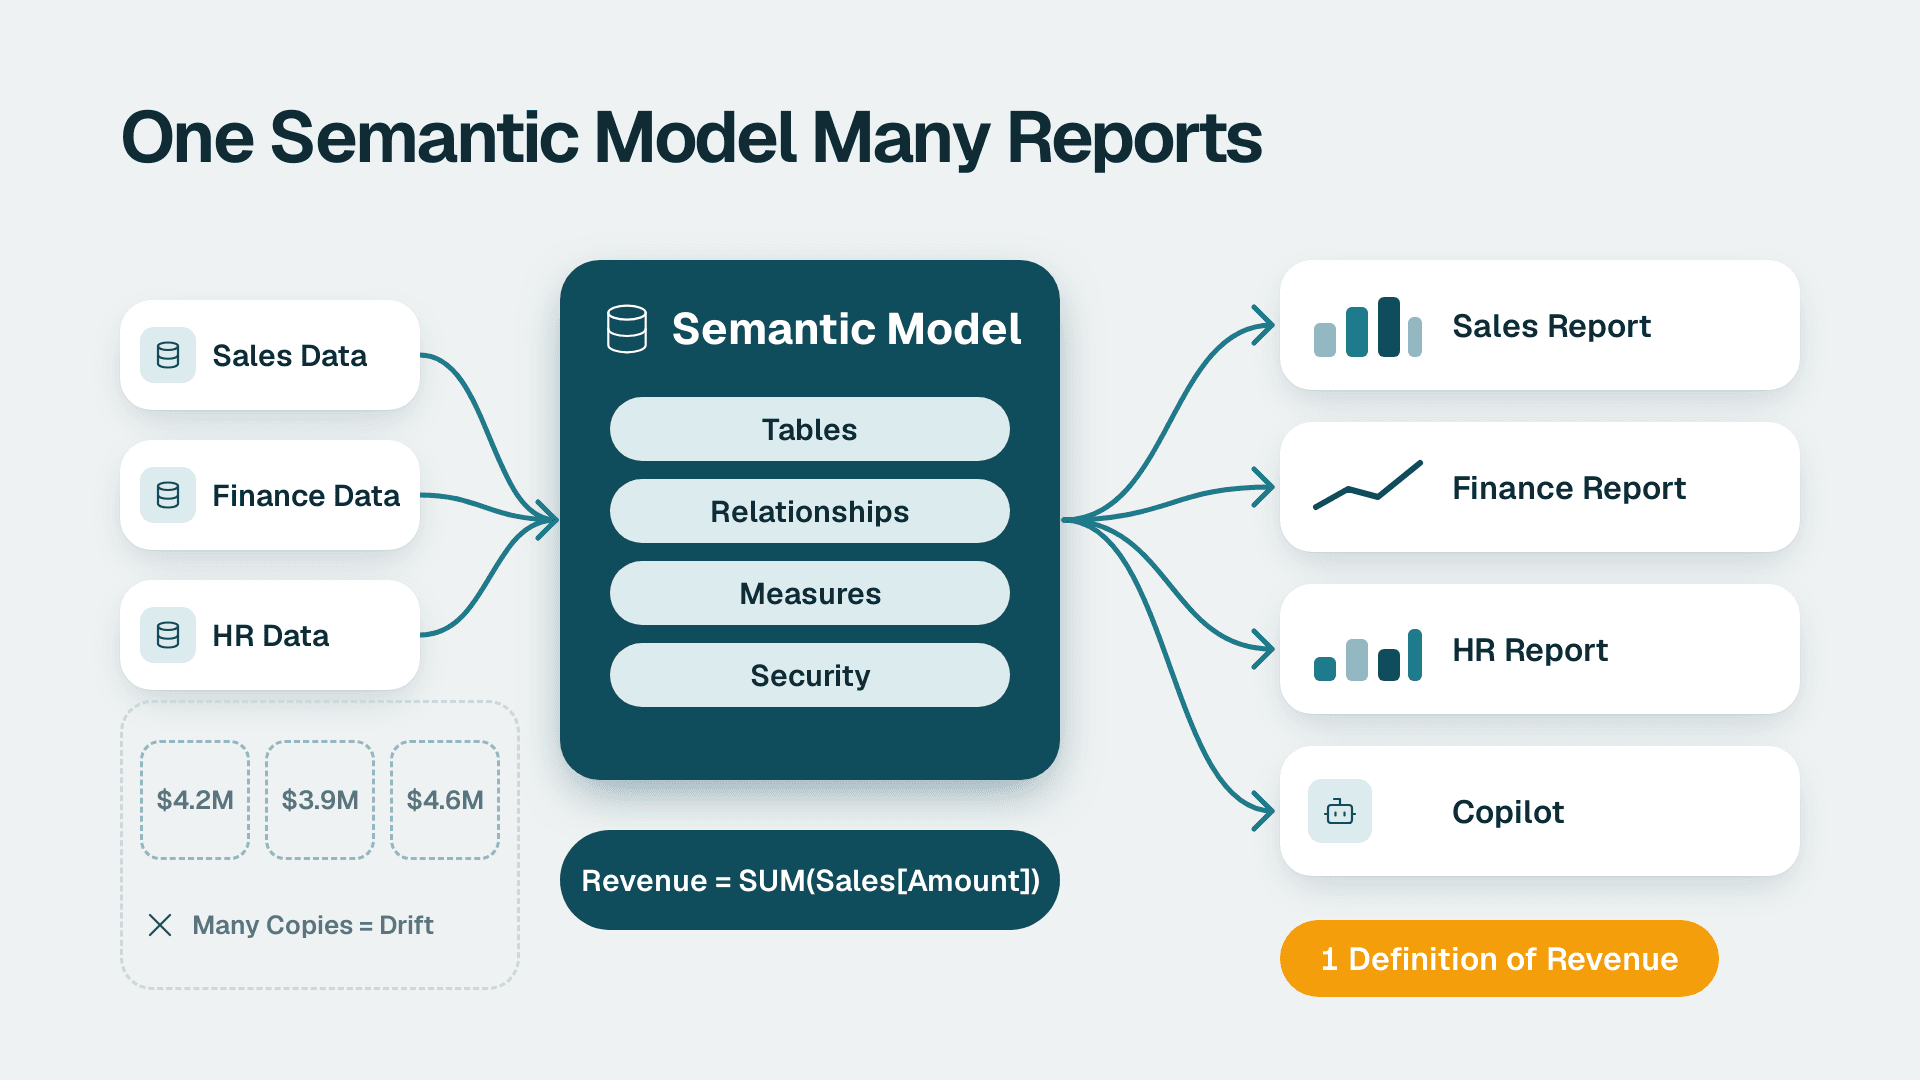
A Power BI semantic model is the governed layer between your raw data and your reports: tables, relationships, measures and security rules defined once, then reused by every report, dashboard and Copilot question. One shared model means one definition of revenue, margin or headcount, instead of a different answer in every copied report.
Key Takeaways
- A semantic model holds your business logic (tables, relationships, measures, security) in one reusable place.
- Many copies of the same report mean many definitions of the same metric; one governed model removes that drift.
- Storage mode (Import, DirectQuery, Composite or Direct Lake) decides how fresh the data is and what it costs to run.
- Copilot answers questions from the model, so a clean, well-named model is the best Copilot preparation, and Copilot itself needs paid capacity.
- Ownership, row-level security and audit retention are what turn a model into a governed asset.
What is a Power BI semantic model?
A semantic model is a reusable data model that stores how your business data is connected and calculated, so reports can ask questions without rebuilding the logic each time. Microsoft's documentation states that, except for streaming semantic models, semantic models represent data models that use Analysis Services modeling technologies. In plain terms, it is the engine and rulebook behind the visuals.
If you have seen the older term, it is the same thing. Until late 2023, Microsoft called semantic models datasets, and plenty of older documentation, forum threads and internal handover notes still use that word.
A model can be created several ways in the Power BI service: connecting to an existing data model not hosted in Power BI, uploading a Power BI Desktop file, uploading an Excel workbook or CSV file, or creating a push or streaming model. Most business models start as a Desktop file connected to a warehouse, an ERP extract or a set of cleaned spreadsheets.
The pieces inside a model are few, and each one matters to someone outside the BI team:
| Component | What it does | Why a finance or ops lead cares |
|---|---|---|
| **Tables** | Hold facts (sales, invoices, tickets) and dimensions (customers, products, dates) | The raw material every number comes from |
| **Relationships** | Link tables so filters flow correctly | Decide whether a region filter changes revenue and cost together |
| **Measures** | Calculations such as net revenue or gross margin, written once | One agreed definition of each KPI |
| **Calculated columns** | Row-level values added to tables | Useful for grouping, but heavier on memory than measures |
| **Hierarchies** | Drill paths such as Year, Quarter, Month | Consistent drill-down across every report |
| **Roles** | Security settings controlling who sees which rows | Keeps a regional manager out of another region's numbers |
If you are earlier in the journey and still deciding what the platform does, the plain-English guide to Power BI for business buyers covers the basics before models come into play. Teams that want outside help structuring their first shared model often scope it through Power BI consulting work focused on one subject area, such as sales or finance, rather than the whole company at once.
What is the difference between a data model and a semantic model?
A data model describes how tables relate; a semantic model is a data model plus the business meaning, calculations and access rules that make it safe to share. In Power BI the two overlap heavily, which is why the words get mixed up.
A Power BI Desktop model is effectively an Analysis Services tabular model, so when an analyst says data model, they usually mean the structure inside Desktop. Once that model is published to the service and others build on it, it becomes a semantic model in the sense that matters to a business: a shared, owned and governed asset.
The practical distinction looks like this:
| Data model | Semantic model | |
|---|---|---|
| Scope | Tables and relationships | Tables, relationships, measures, hierarchies and security |
| Typical owner | One analyst | A named owner, with a backup |
| Audience | The person who built it | Many report authors and consumers |
| Changes | Edited freely | Changed with review, because many reports depend on it |
| Role in Copilot | Not applicable until published | The source Copilot reads and answers from |
The distinction is about treatment, not technology. The same model becomes a semantic model when you decide it is a shared product with an owner and a change process.
A related question people search for is what the Power BI semantic layer is. The semantic layer is the idea; the semantic model is the Power BI object that implements it. It sits above the warehouse or source systems and below the reports, translating technical tables into business terms.
Why does one governed semantic model beat many copies of the same report?
One governed model beats many copies because every copy carries its own definitions, and those definitions drift apart. Fix a margin formula in one report and the other nine still show the old answer, so the meeting turns into an argument about whose number is right.
Copying happens for understandable reasons. A manager wants a slightly different view, so an analyst saves a copy of the file and tweaks it. Each copy has its own data connection, its own refresh schedule and its own measures. After a year, nobody can say which one is authoritative.
The costs of that pattern are concrete:
- Metric drift. Two reports that both say Net Revenue can disagree because one excludes credit notes and the other does not.
- Refresh sprawl. Ten copies mean ten refreshes hitting the same source system, which adds load and ten places where a refresh can fail.
- Security gaps. Row-level rules defined in one copy may be missing in another, so access depends on which file someone opened.
- Rework. A new fiscal calendar or product hierarchy has to be rebuilt in every file.
The alternative is a shared model with thin reports on top. Reports connect to the published model and only add visuals and layout. The logic lives in one place.
| Many report copies | One governed semantic model | |
|---|---|---|
| KPI definitions | One per file | One per measure |
| Fixing a formula | Edit every file | Edit once, all reports update |
| Refresh load on source | Multiplied by copies | Single scheduled refresh |
| Security rules | Re-created and easy to miss | Defined once as roles |
| Audit question: where did this number come from? | Hard to answer | Traceable to one model |
| Copilot answers | Depend on which copy is queried | Consistent, because there is one source |
A finance team makes the point clearly. Suppose a US SaaS company reports monthly recurring revenue in a board pack, a sales dashboard and a customer success view. If each has its own calculation, a variance between them is a credibility problem for the CFO, not a technical footnote. With one model, the measure is defined once and every view inherits it. Deeper guidance on turning a clean model into pages people actually open is in the guide to building Power BI dashboards leaders actually use.
One caution: a single model is not a licence to put everything into it. A model that tries to serve finance, HR, operations and marketing becomes slow and hard to change. The better pattern is one governed model per subject area, with shared dimensions such as date and customer kept consistent across them.
Which storage mode should a semantic model use?
The right storage mode depends on how fresh the data must be and where it lives. Power BI describes four: Import, DirectQuery, Composite and Direct Lake. Each trades speed, freshness and cost differently.
| Storage mode | How it works | Best for | Watch out for |
|---|---|---|---|
| **Import** | Data is loaded into memory and refreshed on a schedule or on demand | Fast reports on data that can be hours old | Models must be fully loaded into memory to be queried, and need refresh to stay current |
| **DirectQuery** | Queries go to the source at report time | Near-live data, or data you cannot copy | Needs connectivity to the source, and a gateway when the source is not reachable over the internet |
| **Composite** | Mixes Import and DirectQuery tables | Large facts live, small dimensions cached | More design effort and more moving parts |
| **Direct Lake** | Reads Delta tables directly from OneLake in Microsoft Fabric | Fabric-based lakehouses | Requires a Fabric setup; no scheduled refresh to manage |
For most mid-market companies starting out, Import is the sensible default. It is simple, fast and well understood. DirectQuery earns its place when a source system, such as an on-premises database, must be queried live. Direct Lake becomes attractive once your data already sits in Fabric.
Storage mode also drives cost. Microsoft lists the settings that can significantly affect capacity resources: where models are hosted, the storage mode, dependencies on gateways, the size of imported data, and model refresh type and frequency. A model with every column imported and a refresh every few minutes uses far more capacity than one trimmed to what reports need.
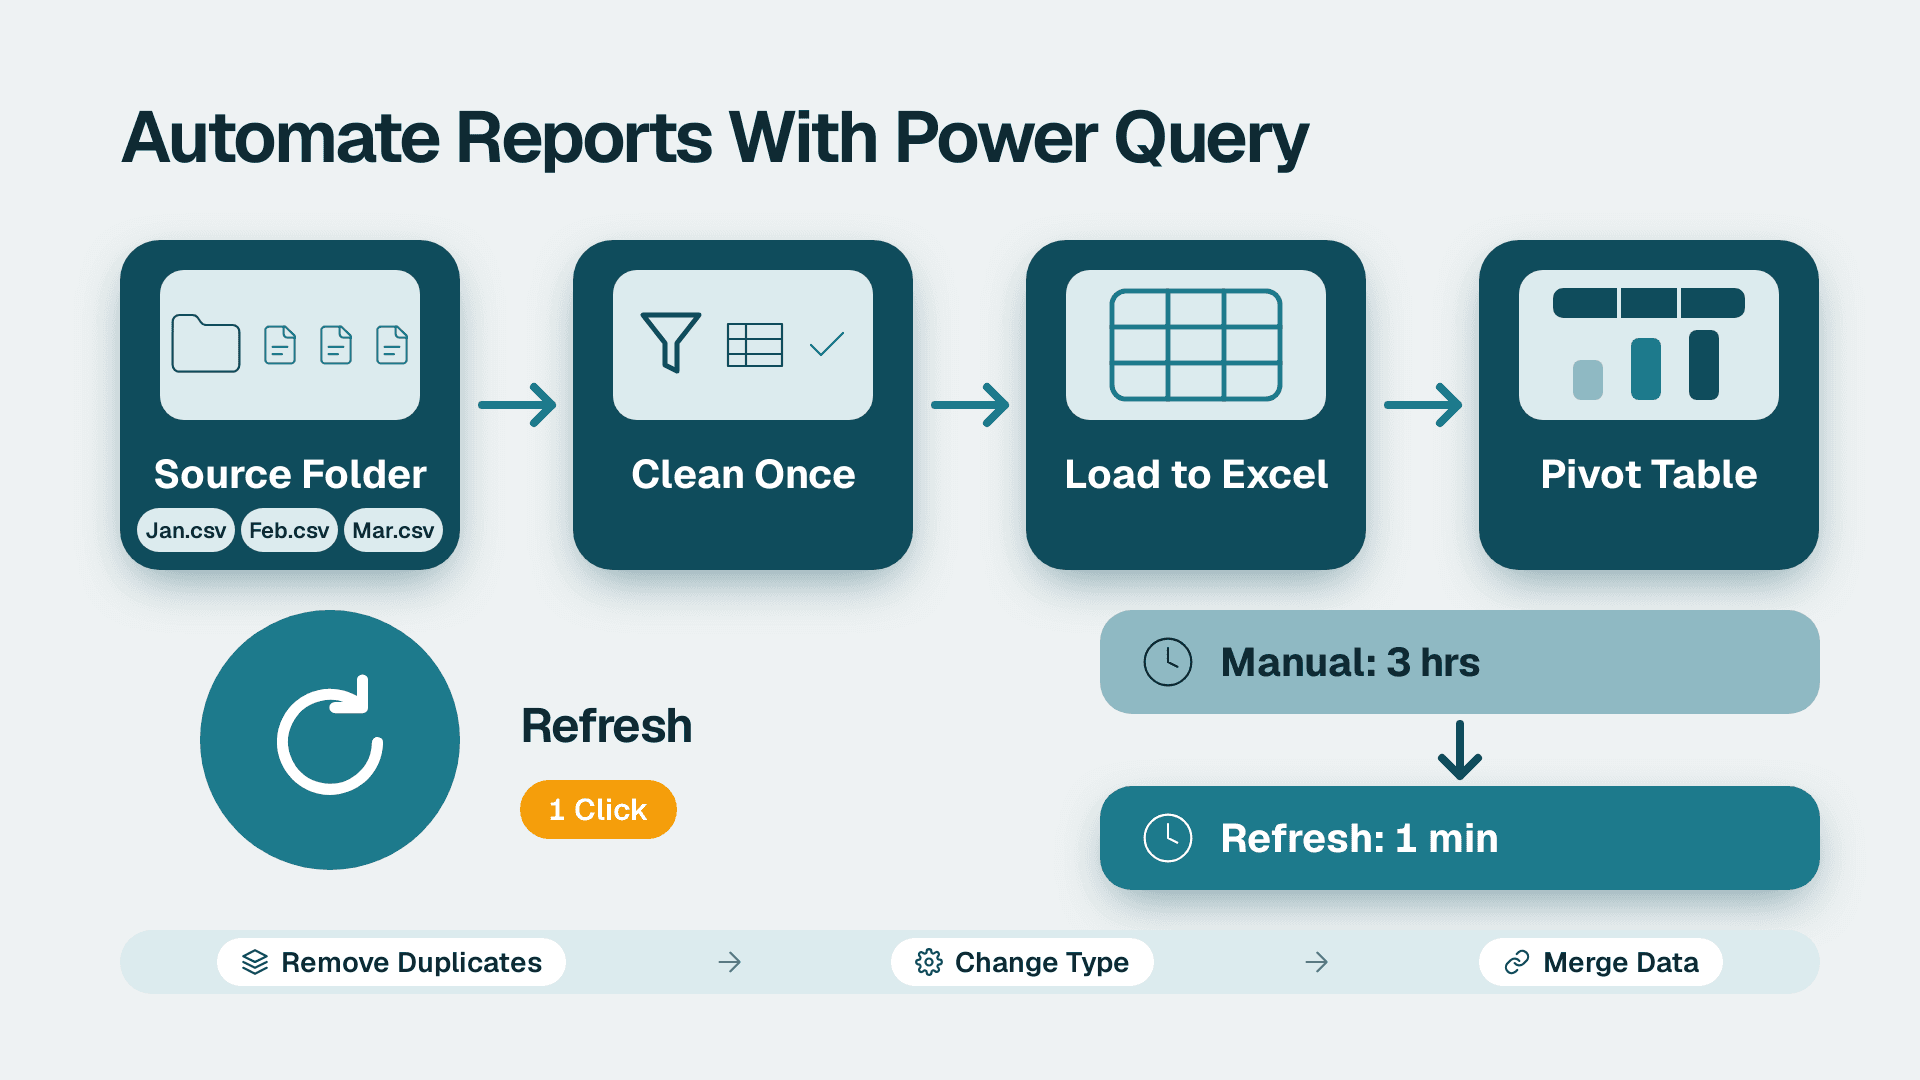
Data preparation matters as much as the mode. Messy source data loaded straight into a model produces messy measures. The walkthrough on using Power Query to clean data before modeling explains the shaping step that should happen before the model, not inside every report.
How does a semantic model feed Copilot?
Copilot in Power BI answers questions by reading the semantic model, so the quality of its answers depends on the quality of the model. It can only be as consistent as the definitions you gave it. If revenue is defined three ways across three copies, Copilot has no way to know which one you meant.
Licensing is the part buyers most often get wrong. Copilot in Power BI and Fabric needs a paid Fabric capacity of F2 or higher, or Power BI Premium P1 or higher. A Pro or Premium Per User licence alone is not enough, and trial capacities are excluded. There is no F64 minimum for Copilot; Fabric Copilot Capacity is a separate F64-and-above feature. For reference, the list prices since 1 April 2025 are $14 per user per month for Power BI Pro and $24 per user per month for Premium Per User. The comparison of Power BI Pro, PPU and Fabric licences sets out which route suits which team size.
What makes a model Copilot-ready is mostly ordinary good modelling:
- Plain business names. A measure called Net Revenue is easier to interpret than one called Measure_47 or NR_v2_final.
- One definition per KPI. Duplicates with slightly different logic invite wrong answers.
- Clean relationships. Filters should flow the way a business user expects, so that selecting a region changes related facts consistently.
- Hidden technical columns. Keys, helper columns and staging fields add noise for anyone, human or AI, browsing the model.
- Descriptions on measures and tables. A one-line explanation of what a measure includes and excludes helps both people and Copilot.
None of this is Copilot-specific work. It is the same hygiene that makes a model trustworthy for people, which is why a governed model is the best preparation for AI. The readiness checks in the AI readiness test to run before Copilot cover the wider data and process questions, and the Power BI Copilot scenario library shows which Copilot use cases tend to hold up in practice.
Expect Copilot to be a convenience layer, not a substitute for governance. It will confidently answer from whatever model it is pointed at. If that model is a stale copy with a retired formula, the answer will be fluent and wrong.
How do you govern a semantic model day to day?
Governing a model comes down to four habits: a named owner, row-level security, controlled change and an audit trail. Without them, a shared model is just a bigger version of the copy problem.
Ownership and continuity
Every model needs an owner and a backup. If you are not the owner of a semantic model, you see a read-only warning when working with gateway and cloud connections, and you must contact the owner or take over ownership to make changes. That is fine until the owner leaves. Microsoft provides a Take Over In Group API for exactly this case, but it is far better to record two named owners than to rely on an emergency fix after someone resigns.
Row-level security
Row-level security (RLS) roles are either static or dynamic. Static roles apply the same filters to everyone assigned to the role, while dynamic roles filter by the report user. For a sales organisation with many territories, a dynamic role driven by a user-to-territory table is easier to maintain than dozens of static roles. The key benefit of defining RLS in the model is that it applies to every report built on it, so a new report cannot accidentally bypass the rules.
Controlled change
Because many reports depend on one model, changes need a lighter version of release discipline. Renaming a measure can break dozens of reports. A simple rule works for most mid-market teams: changes are made in a development copy, checked against a short list of headline numbers, then published. Nothing complicated, but it should be written down.
Audit and compliance
Governance questions tend to arrive from compliance or finance rather than from the BI team. Microsoft Purview Audit (Standard) keeps audit logs for 180 days, so if your review cycle is longer, plan to export or retain the records you need elsewhere.
Regulation shapes what governed means in practice, and the examples below are hypothetical illustrations of framing:
- United States. A US healthcare provider or a finance team working under HIPAA or SOC 2 expectations needs to show who can see which rows and that the rules are applied consistently. One model with defined roles is far easier to evidence than twenty copies.
- UK and EU. A UK fintech firm or an EU retailer under GDPR has to limit access to personal data and be able to explain where it flows. A central model makes it possible to answer a data-subject or auditor question by looking in one place.
- Canada. A Canadian manufacturer handling employee or customer records under PIPEDA benefits in the same way: fewer places where personal information sits, and one set of access rules to review.
In each case the argument is the same. Fewer copies means fewer places for sensitive data to hide and fewer places for a rule to be missed.
Is Power BI still relevant in 2026, and who should build a semantic model?
Yes, Power BI remains a practical choice for mid-market Microsoft shops, and the semantic model is the part of it that rewards investment. Copilot, shared reporting and embedded analytics all rely on a well-built model, so the model is where long-term value accumulates.
A company should build a governed model when any of these are true:
- Two or more reports show the same metric and the numbers disagree.
- Analysts spend meaningful time rebuilding the same calculations in new files.
- Leaders have stopped trusting dashboards and keep asking for the Excel version.
- You plan to roll out Copilot or share reports with clients, and need consistent answers.
- Compliance has asked who can see what, and the honest answer is that it depends on the file.
If you intend to share analytics with external clients, remember that models also underpin that route; the guide to Power BI Embedded for sharing reports with clients without licences explains how that works around a shared model.
Start small. Pick the subject area with the loudest disagreement, usually sales or finance. List the ten to fifteen measures leadership actually uses, agree on each definition in writing with the people who own the numbers, build the model around them and move the existing reports onto it one by one. Retire the old copies once the new ones are verified, otherwise you will simply have created one more version.
A short checklist keeps the first build honest:
1. Name an owner and a backup before building anything.
2. Choose a storage mode deliberately, with Import as the default unless freshness demands otherwise.
3. Clean data upstream, not inside each report.
4. Define security roles in the model, not in individual reports.
5. Write a one-line description for every measure.
6. Decide how changes will be reviewed before the first report depends on the model.
7. Check whether you hold the capacity Copilot needs before promising it to anyone.
The discipline is more important than the tooling. A well-owned model with ten trusted measures does more for a finance or operations team than a sprawling one with two hundred that nobody can explain.
---
About Lets Viz: Lets Viz is a data analytics consultancy that has built Power BI models, dashboards and governance frameworks since 2020, serving US healthcare, UK fintech, Canadian manufacturing and global SaaS teams. We hold a 5.0 Clutch rating, and our work focuses on practical, governed analytics that mid-market teams can run themselves.
Power BI consulting - get one governed semantic model in place so every report and Copilot answer draws on the same trusted numbers.
Sources
Facts and prices checked November 2026.