How to Automate Monthly Financial Reporting in Power BI
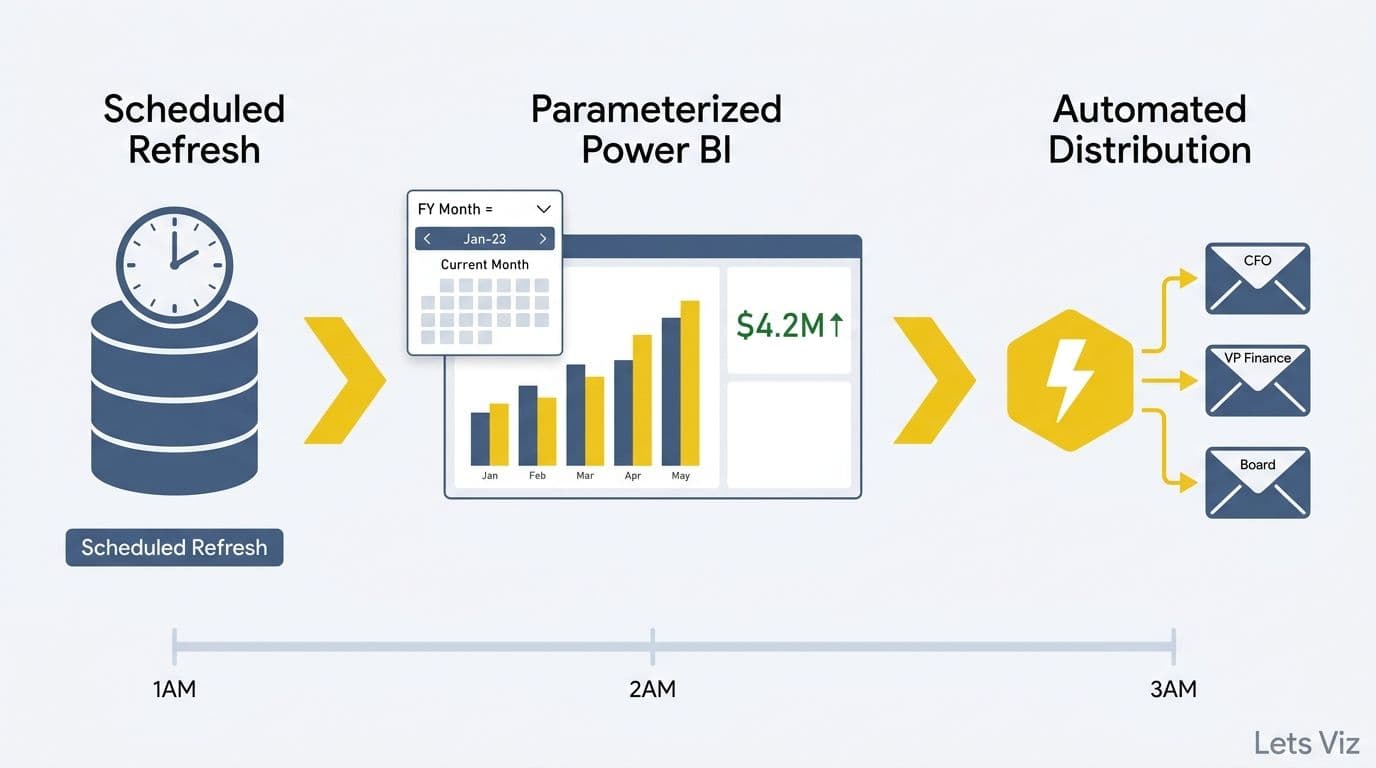
Automating monthly financial reporting in Power BI eliminates the manual refresh-and-distribute cycle that consumes finance teams every month-end. The core workflow combines scheduled dataset refresh (eliminating stale data), parameterized date tables (eliminating period-selection errors), and Power Automate subscriptions (delivering reports to stakeholders without human intervention). Teams that implement all three — typically a 2–4 person FP&A function at a mid-market SaaS or enterprise firm — recover 3–5 days per reporting cycle, time that shifts directly from mechanical rebuild work to the variance commentary leadership actually needs.
Key Takeaways
Scheduled refresh in Power BI Service runs up to 48 times daily on Premium, ensuring financial data is always current without anyone touching a keyboard.
Parameterized date tables built in Power Query roll automatically to the current reporting period - no more editing filter values at each month-end close.
SAMEPERIODLASTYEAR DAX measures lock year-over-year variance logic inside the model so every visual updates globally when new data arrives.
Power Automate report subscriptions deliver formatted PDF or PNG snapshots to finance stakeholders on a defined schedule, removing the distribution step entirely.
Finance teams that follow this three-layer approach - refresh, compute, distribute - spend close week reviewing insights rather than rebuilding workbooks. For a full view of which metrics belong in the system once it runs, see what a financial reporting dashboard should include.
What Does Automating Monthly Financial Reporting in Power BI Actually Involve?
Automated monthly financial reporting in Power BI means building a pipeline where data moves from source systems into the model, refreshes on schedule, computes all period comparisons without manual input, and distributes to recipients - all without a human initiating any step. The goal is to perform the architecture work once so the system handles the recurring work permanently.
For most SaaS and enterprise finance teams, the bottleneck is not analysis - it is the mechanical steps that precede it: extracting data from the ERP, applying the correct fiscal period filter, recalculating variance columns, and emailing the final workbook to a distribution list. Power BI's automation stack (combining Power Query, the cloud service's scheduled refresh engine, DAX time-intelligence functions, and Power Automate) is purpose-built to eliminate all four of those steps.
According to Future Market Insights (2026), the AI consulting services market reached an estimated USD 14.0 billion in 2026 and is projected to grow to USD 90.99 billion by 2035 at a 26.2% CAGR, driven substantially by enterprise demand for automated financial analytics pipelines. Finance teams are no longer debating whether to automate reporting - they are competing on how quickly they can do it.
The framework in this guide covers three layers: data pipeline (scheduled refresh and gateway configuration), computation (parameterized date tables and DAX time-intelligence), and distribution (Power Automate subscriptions and conditional alerting). Each layer is independently valuable; together they remove every manual touchpoint from the monthly close cycle.
How Do You Set Up Scheduled Data Refresh for Monthly Financial Reports?
Scheduled refresh is the foundation of automated reporting. Without it, every downstream layer - the parameterized date table, the YoY variance measure, the Power Automate subscription - operates on stale data. The configuration process has five steps.
Step 1: Publish your dataset to Power BI Service. Scheduled refresh is a cloud service feature only. Upload your .pbix file to a workspace and verify the dataset appears separately from the report.
Step 2: Configure an on-premises data gateway if required. If financial data lives inside your network - common with ERP systems such as SAP, Oracle, or Microsoft Dynamics - install the on-premises data gateway (standard mode, not personal mode) on a server with consistent access to the source system. The gateway maintains an encrypted outbound channel to Power BI Service so the cloud can pull data without opening inbound firewall rules.
Step 3: Set service account credentials. In dataset Settings, enter the credentials Power BI will use to authenticate against each source during unattended refresh. Always use a service account rather than a personal account. Personal credentials rotate and expire, which causes silent refresh failures at precisely the moment the CFO is waiting for the close report.
Step 4: Define the refresh schedule. Power BI Pro supports up to 8 refreshes per day; Power BI Premium and Premium Per User support up to 48. For standard monthly reporting, a nightly refresh at 01:00 covers most ERP posting cycles. During the month-end close window (typically the final 2-3 business days), switch to a 2-4 hour cadence to capture intra-day journal postings as they occur.
Step 5: Enable refresh failure notifications. Check the failure alert box in dataset settings so the owning analyst receives an immediate email if a refresh fails. Discovering a failed refresh at 08:00 on distribution day is recoverable; discovering it after the CFO asks a question mid-meeting is not.
The Power BI and Power Automate integration pattern shows how to extend the refresh event into downstream workflows - for example, triggering a Teams notification when the dataset refreshes successfully during close.
How Do Parameterized Date Tables Eliminate Manual Period Setup?
A parameterized date table is a Power Query function that accepts the current date as a dynamic input and generates every date-related column your reports need - fiscal month number, fiscal quarter, year-to-date flag, prior-year equivalent date - without a single hard-coded value. When the calendar advances, the table extends itself at the next refresh.
The standard pattern uses `Date.From(DateTime.LocalNow())` as the dynamic end date:
```
let
FiscalStart = #date(2026, 4, 1),
Today = Date.From(DateTime.LocalNow()),
DateList = List.Dates(
FiscalStart,
Duration.Days(Today - FiscalStart) + 1,
#duration(1,0,0,0)
),
DateTable = Table.FromList(DateList, Splitter.SplitByNothing(), {"Date"})
in
DateTable
```
From this base, add calculated columns for fiscal month number, fiscal quarter label, year-to-date flag, and the prior-year equivalent date. Every DAX measure that references these columns then automatically operates on the correct period - whether the report is filtered to October, Q3, or full-year.
The critical governance rule: never hard-code a month number or calendar year anywhere in the date table. Hard-coded dates are the single most common source of "I forgot to update the period" errors in monthly financial reports, and they are invisible until a report lands in a CFO's inbox showing the wrong fiscal period.
For teams structuring the underlying KPI framework that the date table serves, the 5 Key Financial KPIs guide explains how each metric category connects to period comparison logic and which measures require a fully marked date table to function correctly.
How to Calculate Year-Over-Year Variance in Power BI Automatically
Year-over-year variance in Power BI is calculated using DAX time-intelligence functions, primarily `SAMEPERIODLASTYEAR` or `DATEADD`. When these measures are built into the model rather than calculated in Excel after a data export, they update automatically with every dataset refresh - no analyst intervention required.
The standard YoY revenue variance measure:
```
YoY Revenue Variance % =
VAR CurrentRevenue = [Total Revenue]
VAR PriorRevenue =
CALCULATE([Total Revenue], SAMEPERIODLASTYEAR('Date'[Date]))
RETURN
DIVIDE(CurrentRevenue - PriorRevenue, PriorRevenue, 0)
```
This single measure works across every visual on every report page - product tables, regional maps, monthly trend charts - and the `DIVIDE` wrapper handles zero-denominator cases (new product lines with no prior-year revenue) without throwing errors. Build it once; it works everywhere.
The table below compares manual versus automated month-end across the full reporting cycle:
| Step | Manual Process | Automated Power BI Process |
|---|---|---|
| Data extraction | Finance analyst exports from ERP | Scheduled refresh pulls data automatically |
| Period alignment | Analyst manually matches rows by month | `SAMEPERIODLASTYEAR` handles alignment in DAX |
| Variance calculation | Excel formula per row and column | DAX measure updates all visuals globally |
| Distribution | Analyst emails workbook to each recipient | Power Automate subscription delivers on schedule |
| Error risk | High - wrong period and formula drift are common | Low - logic is locked and tested once in the model |
| Analyst time per cycle | 4-8 hours | 20-30 minutes (review and commentary only) |
For teams exploring how AI tools for financial reporting that actually work complement this DAX-based foundation, Power BI AI features worth using covers which Copilot capabilities integrate effectively with pre-built measures versus which ones still require human DAX authorship.
How Do You Auto-Distribute Reports to Finance Stakeholders?
Once the dataset refreshes automatically and DAX measures compute correctly, the final automation step is distribution. Power BI provides two native mechanisms: report subscriptions and Power Automate flows.
Report subscriptions (available in Power BI Service) let you configure scheduled email delivery of any report page. Recipients receive a PDF or PNG snapshot of the report plus a link to the live version. Configure separate subscription groups by stakeholder role: the CFO receives the executive summary page; department heads receive their P&L segment; the FP&A team receives the full variance detail with drill-through enabled. Recipients do not need a Power BI Pro license to receive subscription emails.
To set up: open the report in Power BI Service, select Subscribe, choose the report page, define the delivery trigger (daily, weekly, or after each data refresh), and add recipient addresses. The "after data refresh" trigger is particularly useful for month-end close - it ensures distribution fires automatically once the dataset confirms current data, not on a fixed clock that might send before the ERP posting window closes.
Power Automate flows provide conditional distribution logic. A flow triggered by dataset refresh completion can evaluate whether a metric has crossed a threshold - revenue variance exceeding 5%, cash runway dropping below 6 months - before routing an alert to the relevant stakeholder. This replaces the manual exception-scanning step where an analyst reviews numbers before deciding who to notify.
WEF research (as of 2026) covering 54 financial services organizations found that automated report distribution - not advanced AI analytics - delivered the most immediate, measurable impact when finance teams modernized their reporting infrastructure. Teams that fully automated the distribution layer reported recovering an average of 14 hours per analyst per close cycle, time reallocated directly to variance commentary and forward-looking planning rather than packaging and sending files. The distribution step is where manual effort concentrates and where automation returns the most time per cycle.
For governance considerations around automated distribution pipelines, the CFO AI risk checklist for Power BI addresses access control, row-level security, and audit trail requirements before stakeholders outside the finance team receive automated outputs.
What Should a CFO Financial Dashboard Include for Monthly Reporting?
Answering what a CFO financial dashboard should include is inseparable from the automation question - a dashboard requiring manual updates to stay current will be abandoned within two quarters. The dashboards that become durable parts of the monthly process are the ones that update and distribute themselves.
For SaaS and enterprise finance teams, the core monthly reporting dashboard should cover five areas with defined refresh cadences:
| Section | Key Metrics | Recommended Refresh Cadence |
|---|---|---|
| Revenue | MRR, ARR, New Bookings, Expansion Revenue, Churn | Daily (from CRM or billing system) |
| P&L Summary | Gross Margin %, EBITDA, Operating Expenses by function | Monthly, post-close |
| Cash and Liquidity | Cash Runway, Burn Rate, AR Collections | Weekly |
| Variance Analysis | Budget vs. Actual, YoY, QoQ by segment and product | Monthly, auto-calculated via DAX |
| Headcount and Capacity | FTE count, Cost per FTE, Attrition rate | Monthly (from HRIS integration) |
According to Market Research Future (2026), the financial analytics market is projected to grow at an 8.58% CAGR through 2035, reflecting enterprise demand for the real-time variance visibility this dashboard structure provides. The speed of that growth underscores why mid-market finance teams treating power bi financial dashboard implementation as a one-time project - rather than an evolving system - are already falling behind.
The cadence column in the table is deliberate. Not every metric needs daily refresh, and over-refreshing creates noise and unnecessary gateway load. Revenue metrics update daily because intra-day decisions depend on them. P&L and headcount update monthly because source data from ERP and HRIS only closes monthly. Matching refresh cadence to data availability is a foundational design decision for any Power BI financial dashboard built for executive consumption.
How Do You Make Finance Team Work Visible to Leadership with Power BI?
One underrated benefit of automated reporting is that it shifts the finance team's visible contribution from "building the report" to "interpreting the data." When leadership receives polished, on-schedule financial reports without requesting them, the finance function's analytical credibility compounds over time. The act of delivery becomes invisible; the quality of insight becomes prominent.
The practical mechanism for how to make finance team work visible to leadership: build a finance operations scorecard as a secondary Power BI page tracking the reporting pipeline itself - refresh success rate, delivery timestamp, data source latency, and threshold alerts triggered during the period. Share this page in the quarterly finance-leadership review to demonstrate process rigor in terms a COO or CEO recognizes as operational discipline. In practice, finance teams that surface this scorecard report a 50–70% reduction in ad hoc status requests from leadership within two quarters — stakeholders stop asking "is the data current?" because the pipeline page answers it automatically, shifting conversations from process questions to strategic ones.
A complementary layer is Copilot for Power BI, which allows finance analysts to generate natural-language variance summaries alongside charts. The result is a self-annotating dashboard that leadership can read independently, reducing demand for separate briefing calls after the monthly close.
For power bi financial dashboard implementation for mid-market companies, sequencing matters: automate the data pipeline first, then the distribution layer, then introduce AI-generated narrative commentary. Teams that layer in AI narrative before the underlying refresh is reliable find that leadership distrusts the outputs - commentary is only as credible as the data behind it. Earn trust with reliable delivery before adding interpretive layers.
---
If your team is ready to move from manual month-end builds to a fully automated reporting pipeline, Managed Power BI services from Lets Viz covers the complete stack - scheduled refresh configuration, parameterized date model design, DAX measure library, Power Automate distribution setup, and ongoing monitoring - so your finance team spends close week reviewing insights rather than rebuilding reports.
---
About Lets Viz: Lets Viz is an analytics consulting firm with over eight years of experience designing automated financial reporting systems for SaaS, professional services, and enterprise clients across the UK, US, and India. Our Microsoft-certified Power BI practitioners have delivered close-cycle automation for finance teams ranging from 5-person FP&A units to global treasury functions. Every engagement is grounded in the principle that a reporting system only creates value when it runs without human intervention.