Which Power BI Dashboard to Build First: 6 Ranked by Function
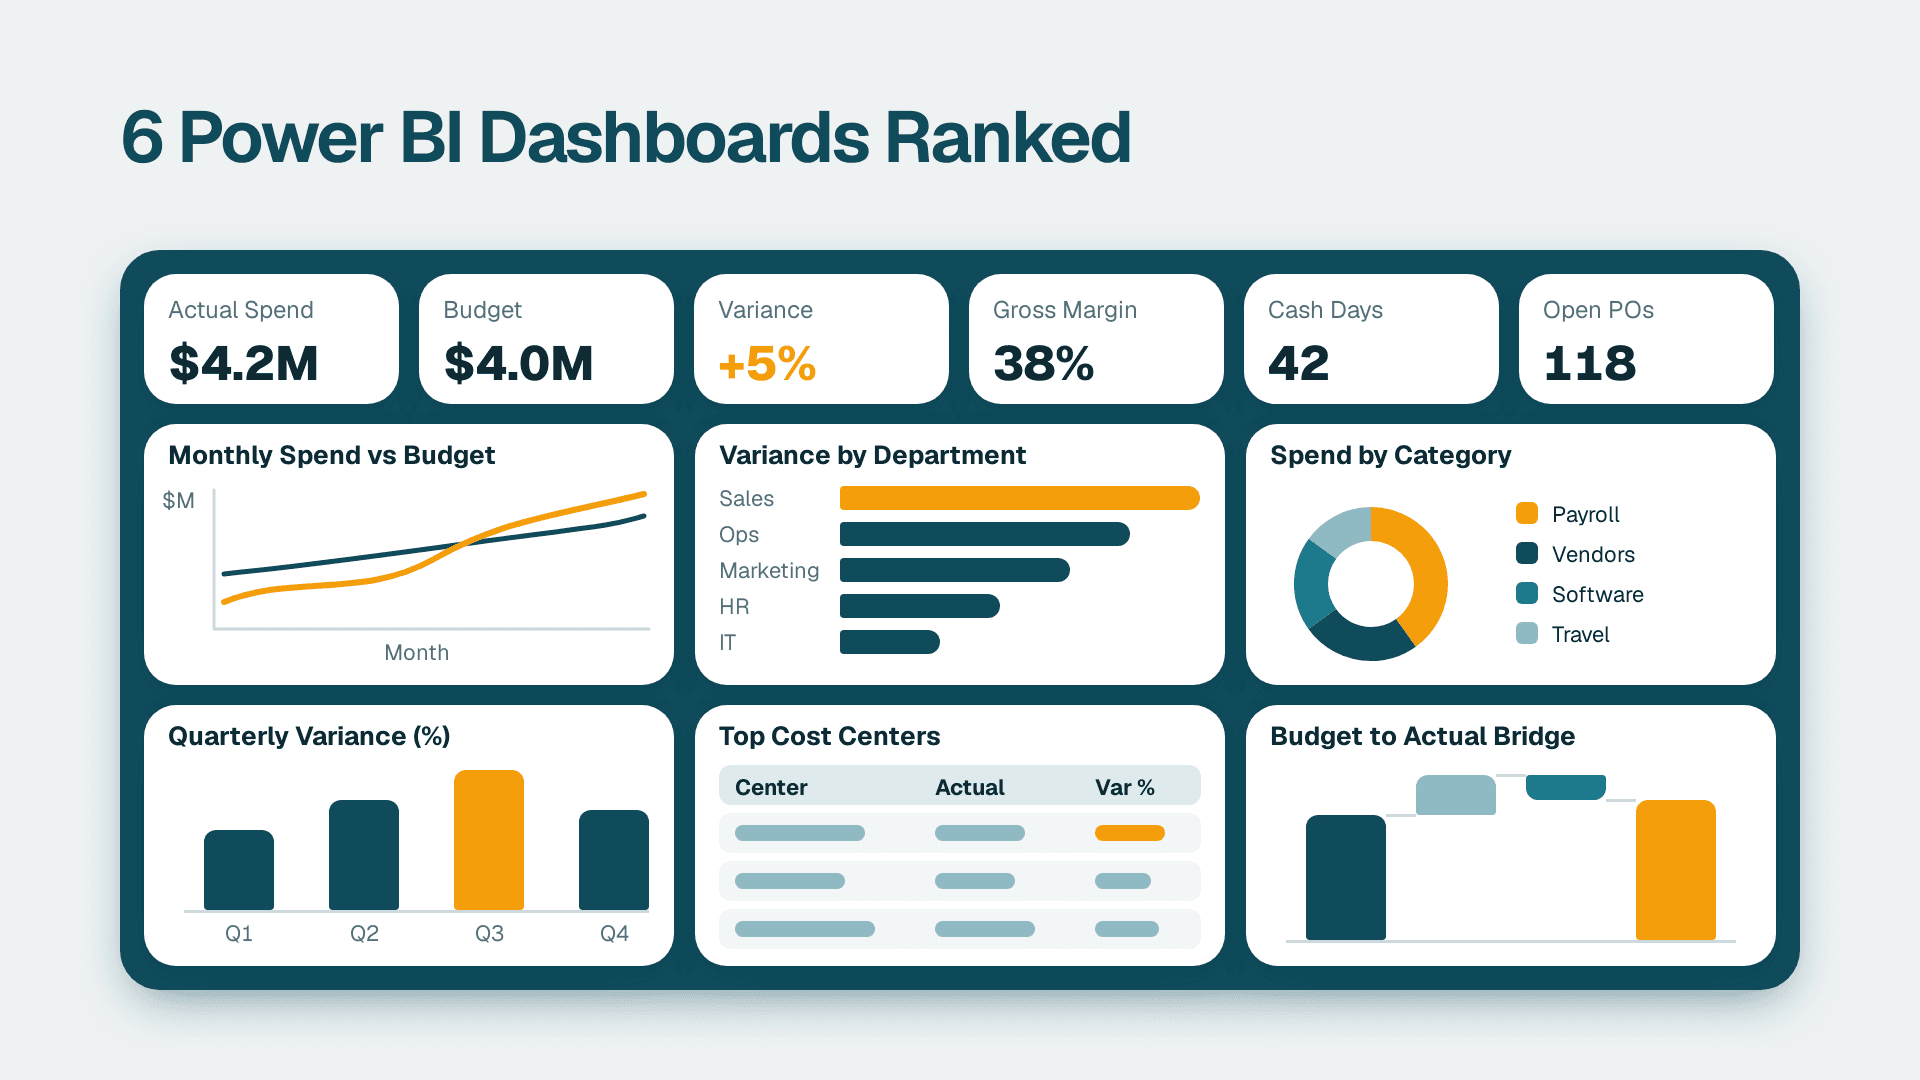
The Power BI dashboard to build first is the finance spend and variance dashboard. It supports the most frequent, highest-stakes decisions and runs on data most mid-market firms already hold in a general ledger. Sales pipeline ranks second, followed by operations, marketing, HR hiring and an AI-assisted analysis page. Each entry below names the decision it supports and the data it needs.
Looking for finished examples rather than a build order? Browse our Power BI dashboard gallery. This guide answers a different question: which one to build first.
Key Takeaways
- Start with finance, then sales: they pair the clearest decisions with the cleanest source data.
- A dashboard is worth building only if it maps to one named decision and one named owner.
- Microsoft's 2026 refresh ships eight downloadable sample reports, so you can open a real power bi dashboard sample before you spend anything.
- Data readiness, not visual design, decides how long each build takes.
- Power BI Pro lists at $14 per user per month, and Copilot narratives need paid Fabric capacity, not just a Pro seat.
Our Ranking Criteria
These six dashboards are ranked for buyers deciding whether and how to roll out Power BI, not for analysts learning the tool. If you want help scoping any of them, our Power BI consulting team builds these for mid-market US companies. We scored each example on five criteria:
- Decision value: the dashboard changes a real, recurring decision, such as approve spend, chase a deal or reorder stock, rather than just displaying numbers.
- Data readiness: the source data usually exists already in an ERP, CRM or spreadsheet and needs light cleanup, not a new system.
- Build effort: a competent team can ship a first useful version in weeks, not quarters.
- Adoption likelihood: the people who own the decision will open it weekly without being chased.
- Reuse across companies: the layout works in most mid-market firms with modest changes, so you are not designing from zero.
Note on the data: Microsoft's sample reports use fictional data. They show what is possible and how the visuals are wired, but your own numbers will expose the real work, which is mapping and cleaning source data.
1. Finance Spend and Variance Dashboard: Best Overall Starting Point
This is the finance example most CFOs ask about when they search for a power bi financial dashboard template. It shows spend against budget by department, vendor and category, with variance flagged using conditional formatting. Microsoft's Corporate Spend sample is a good reference: it uses conditional formatting, a button slicer, card reference labels and field parameters, which let a reader switch between spend views without a new page.
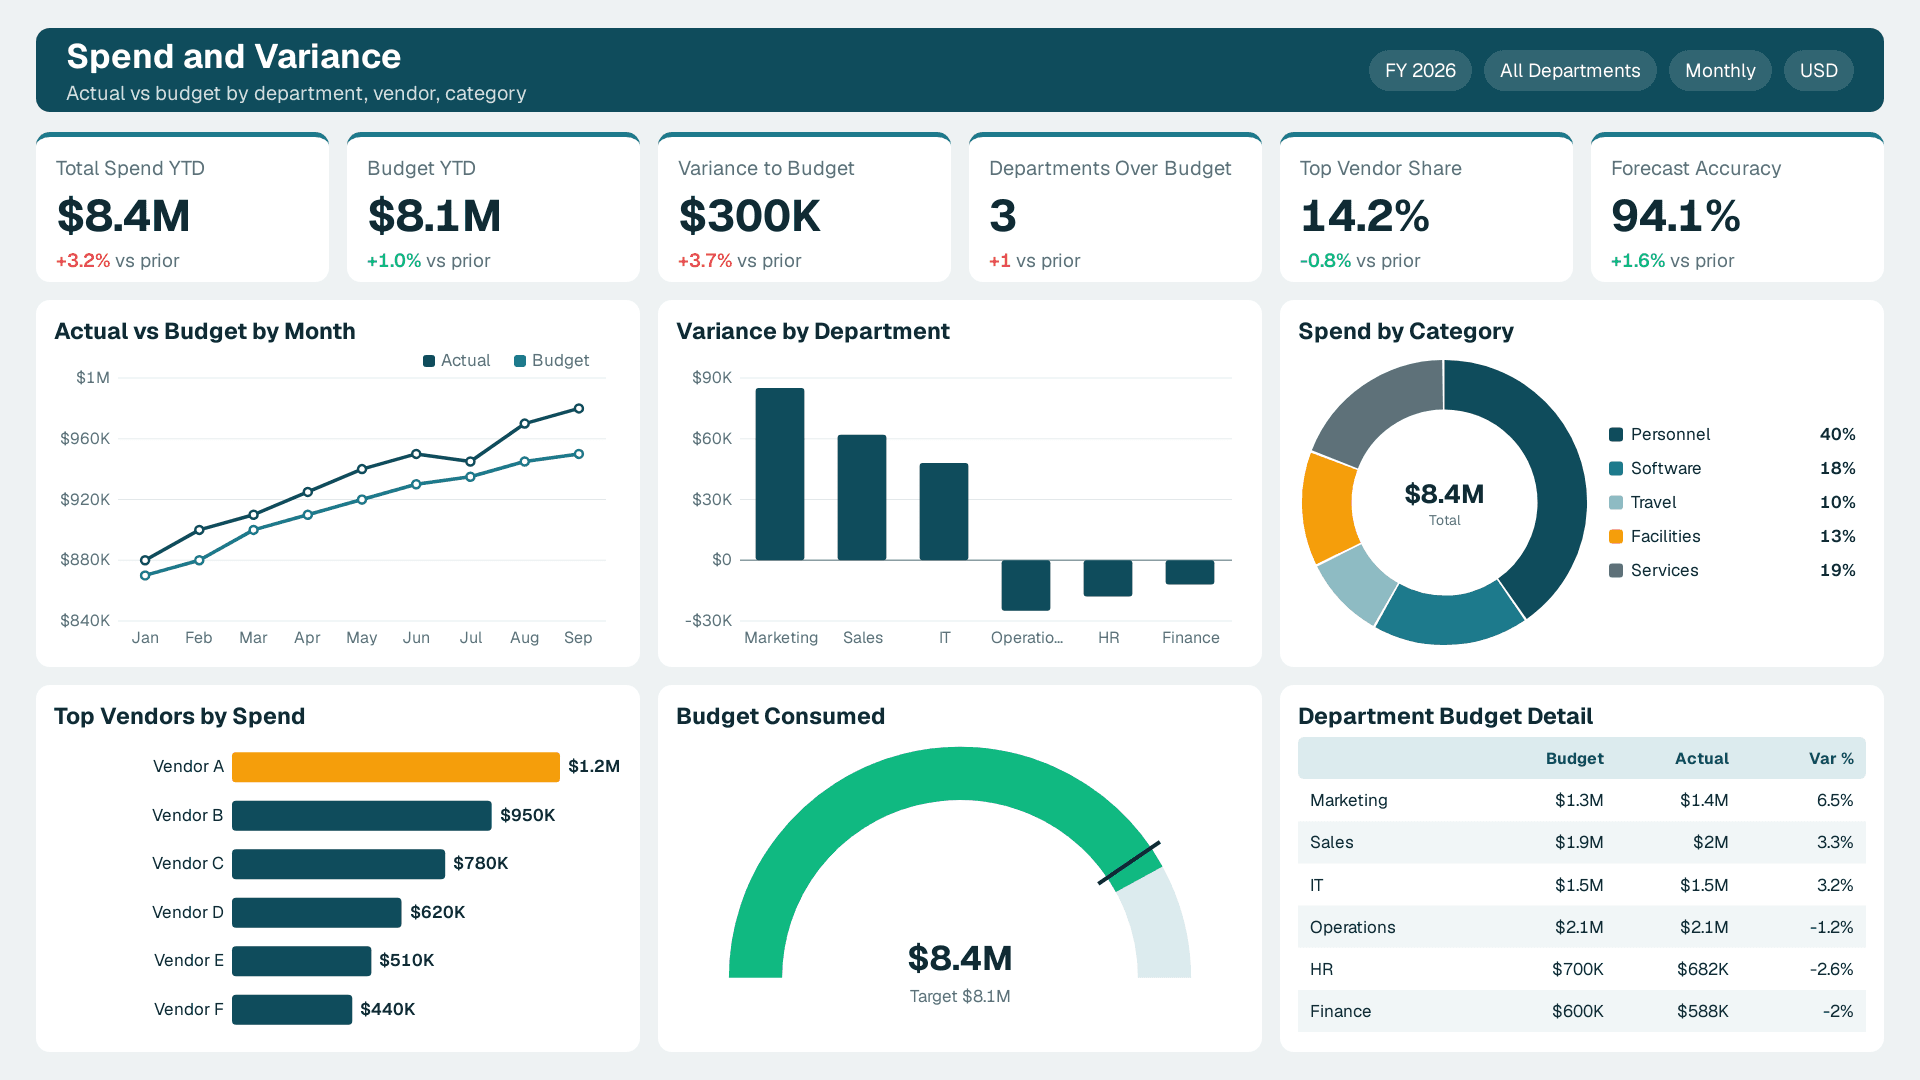
Decisions it supports: approve or freeze discretionary spend, escalate a department running over budget, and prepare the monthly board pack.
Data it needs: a general ledger or trial balance export, a budget table at the same grain, and a clean department and vendor list. If the ledger is messy, start with the cleanup steps in How to Use Power Query to Clean Data Before Modeling in Power BI.
Best for: CFOs, finance managers and controllers at mid-market companies that still build the monthly pack by hand.
See a finished version: our Power BI finance dashboard.
Pros:
- Highest-stakes decisions and a built-in weekly audience.
- Source data is structured and usually already reconciled monthly.
- Variance logic is simple to explain and trust.
Cons:
- Trust collapses if the dashboard disagrees with the ledger by even a small amount, so reconciliation work is non-negotiable.
- Budget data often lives in spreadsheets with inconsistent formats.
2. Sales Pipeline and Revenue Dashboard: Best for Revenue Visibility
This example tracks open pipeline by stage, owner, region and expected close date, with win rate and forecast against target. Microsoft's Revenue Opportunities sample combines a Shape Map, a report page tooltip and a combo chart for pipeline analysis, and the Regional Sales sample is a useful companion for territory views. The refreshed semantic models also add measures for common analysis such as win percentage.
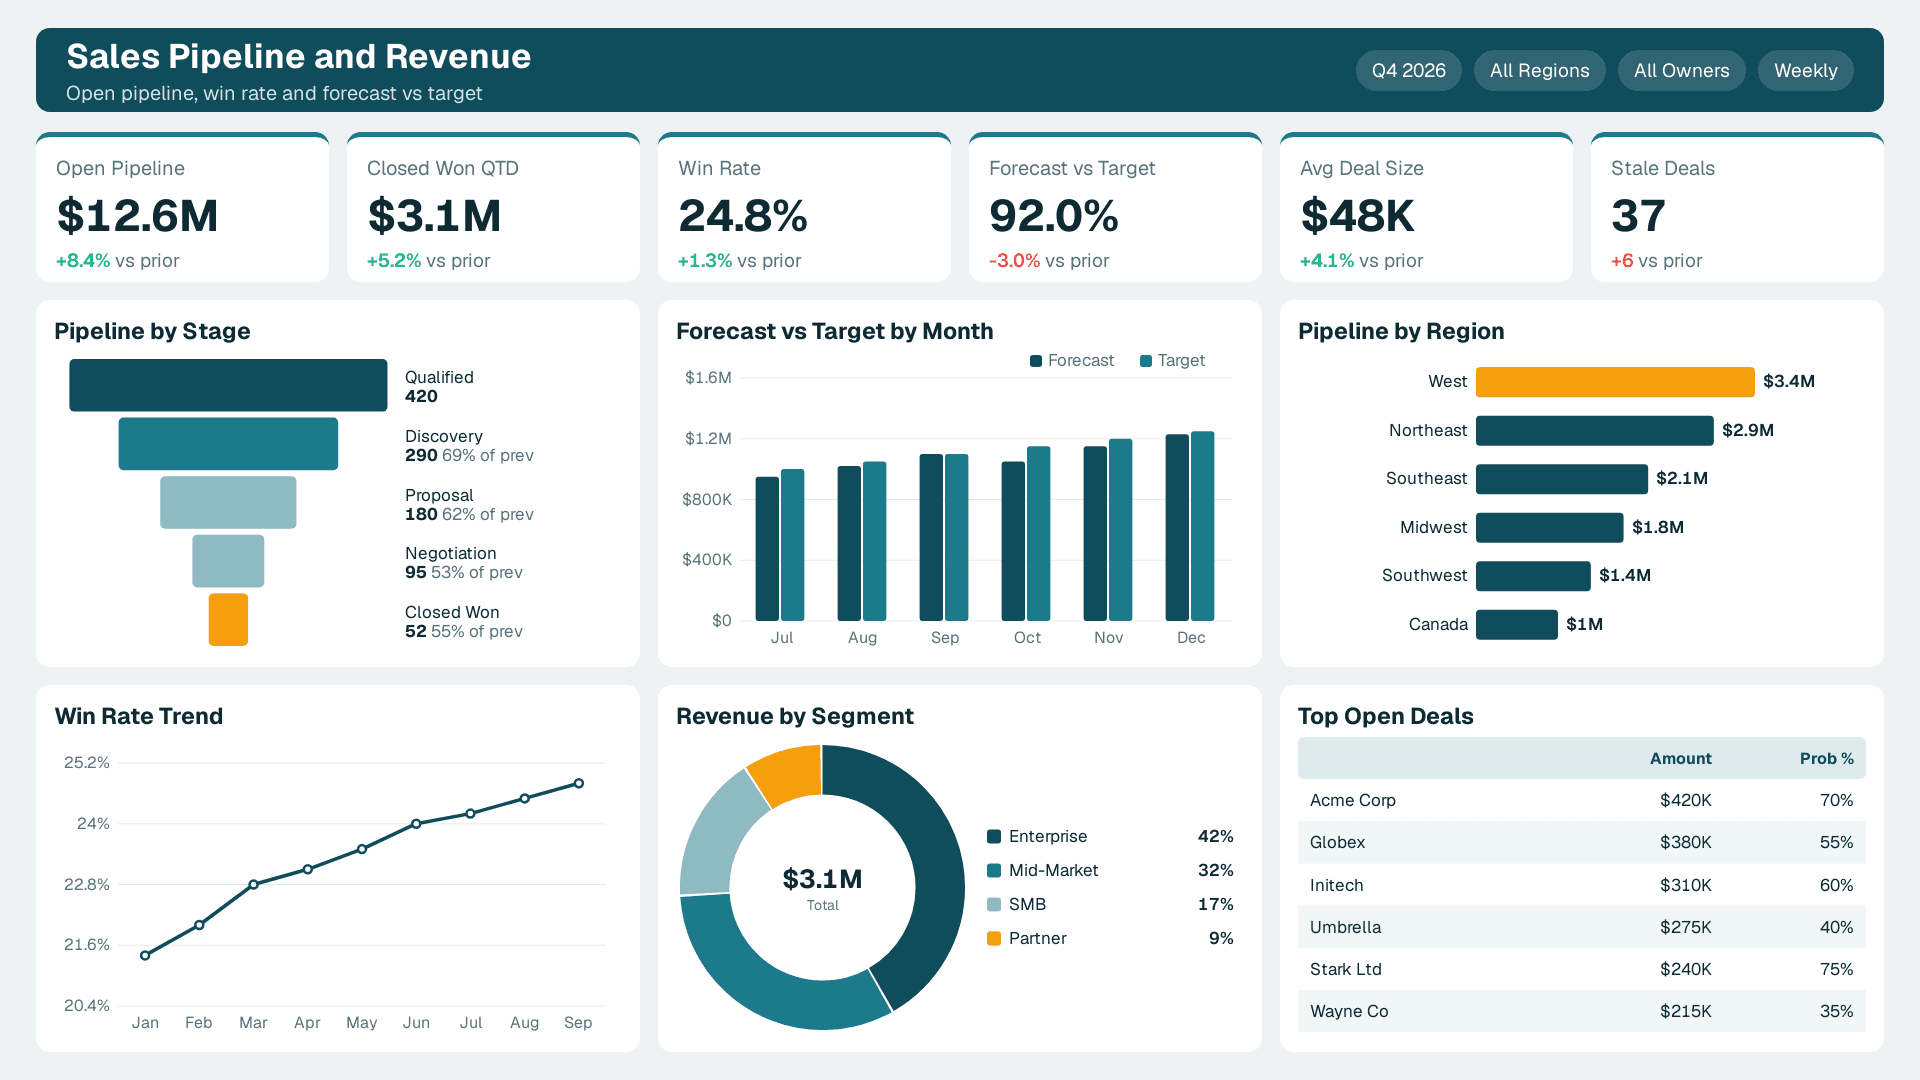
Decisions it supports: where managers spend coaching time, which deals need executive help, whether the quarter is on track and which territories are under-covered.
Data it needs: CRM opportunity records with reliable stage, amount, owner and close-date fields, plus a quota or target table. Stage definitions must be consistent, or win rate means nothing.
Best for: sales leaders and RevOps managers who currently pull forecasts from CRM exports into spreadsheets.
See a finished version: our Power BI sales dashboard.
Pros:
- Clear weekly rhythm: it gets opened in every pipeline review.
- Data comes from one system in most mid-market firms.
- Easy to show quick wins, like stale deals with no activity.
Cons:
- Garbage in, garbage out: reps who skip CRM updates make the dashboard look wrong.
- Forecast logic is political, so agreeing the rules takes longer than building the visuals.
3. Operations and Inventory Dashboard: Best for Cost and Service Control
This example covers stock levels, backorders, fulfilment time, supplier performance and store or site comparisons. Microsoft's Store Sales and AdventureWorks Sales samples show the layout patterns, and the refreshed semantic models add measures such as high backorder risk and calculation groups for period comparisons.
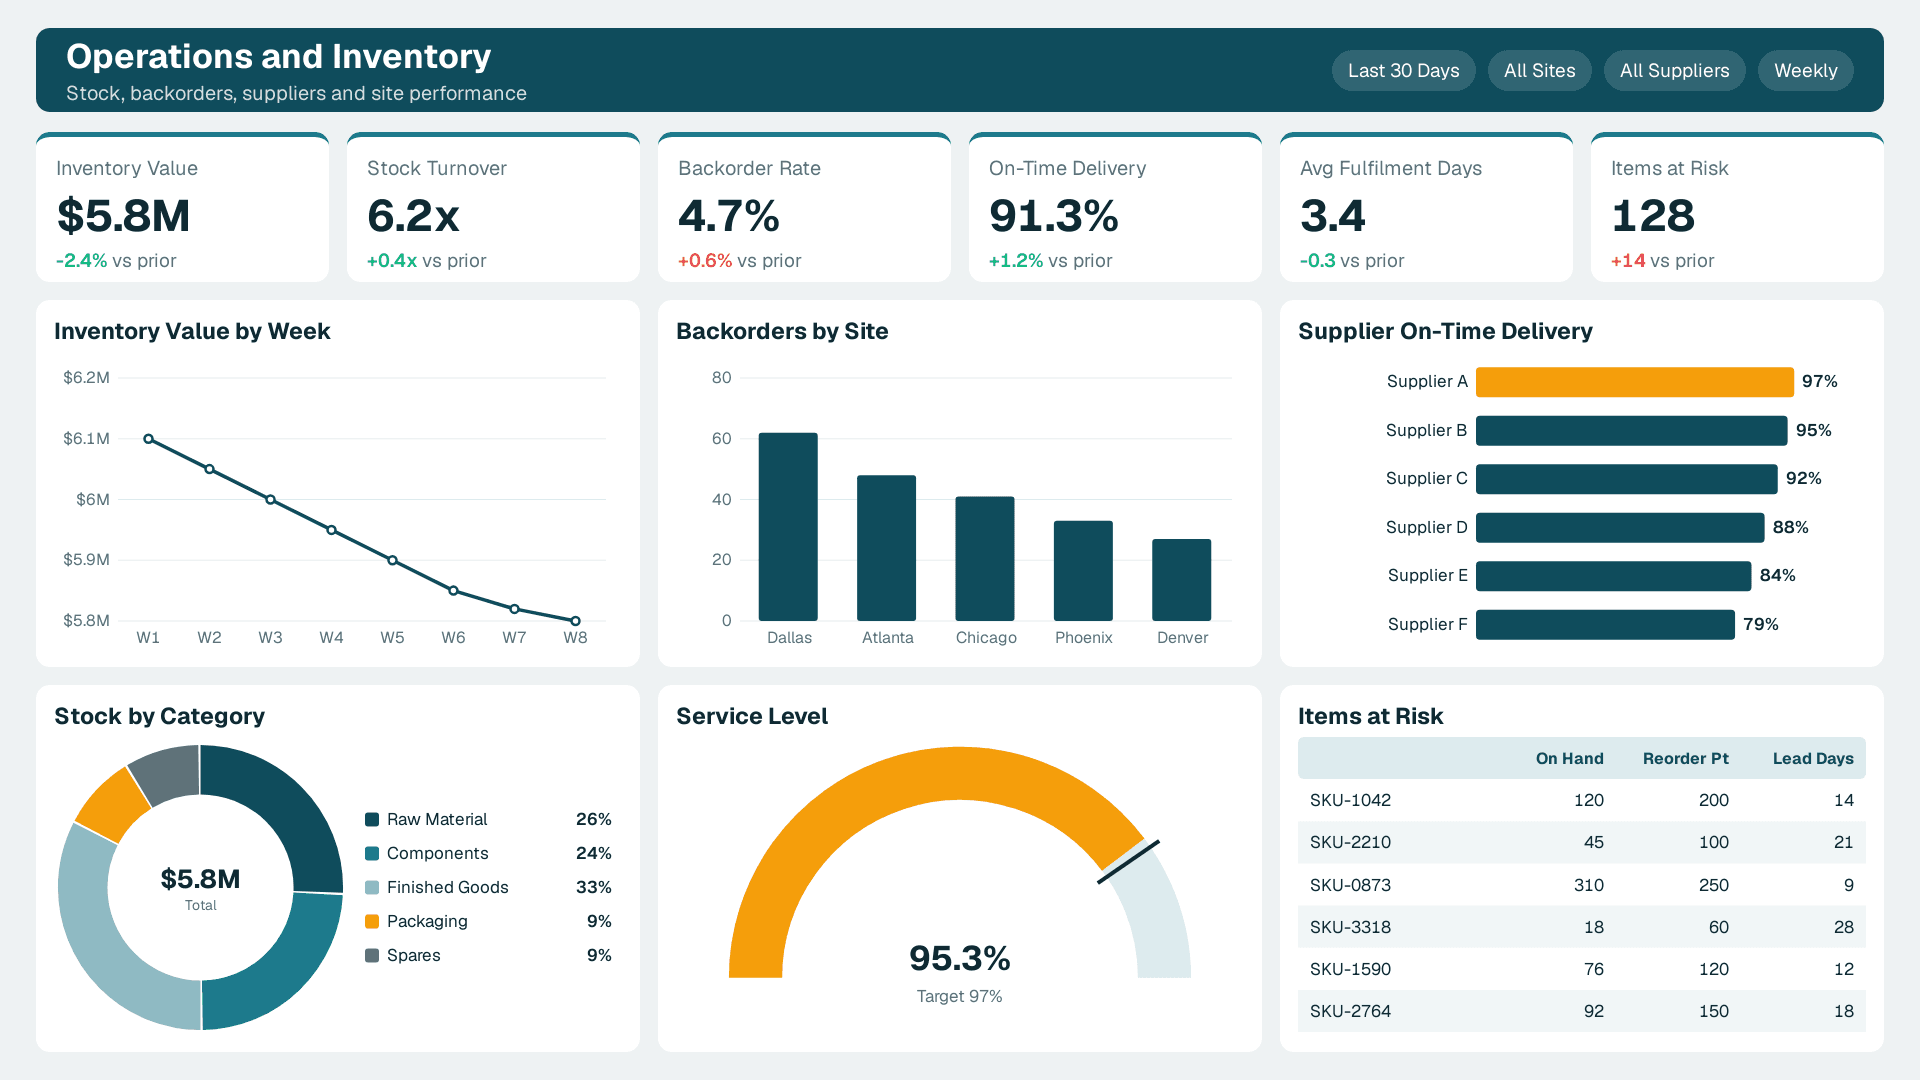
Decisions it supports: what to reorder this week, which supplier is failing on delivery, where to move stock and which sites are underperforming against peers.
Data it needs: inventory and order data from your ERP or warehouse system, supplier lead times and a location master list. Date tables and consistent product keys matter more here than anywhere else.
Best for: operations heads, supply chain managers and plant or store managers who need daily or weekly refresh.
See a finished version: our operations dashboard.
Pros:
- Direct link to cash tied up in stock and to service levels.
- Exception views, such as only items at risk, cut noise sharply.
- Period comparison patterns carry over to many other reports.
Cons:
- ERP data models are complex, so extraction and joins take real effort.
- Needs a refresh schedule that matches how fast the business moves.
4. Marketing Performance Dashboard: Best for Channel Accountability
This example combines spend, leads, cost per lead and pipeline contribution by channel and campaign. Microsoft's Competitive Marketing Analysis sample is the closest reference, built to compare performance against the market. Pair it with CRM data and the picture moves from clicks to revenue.
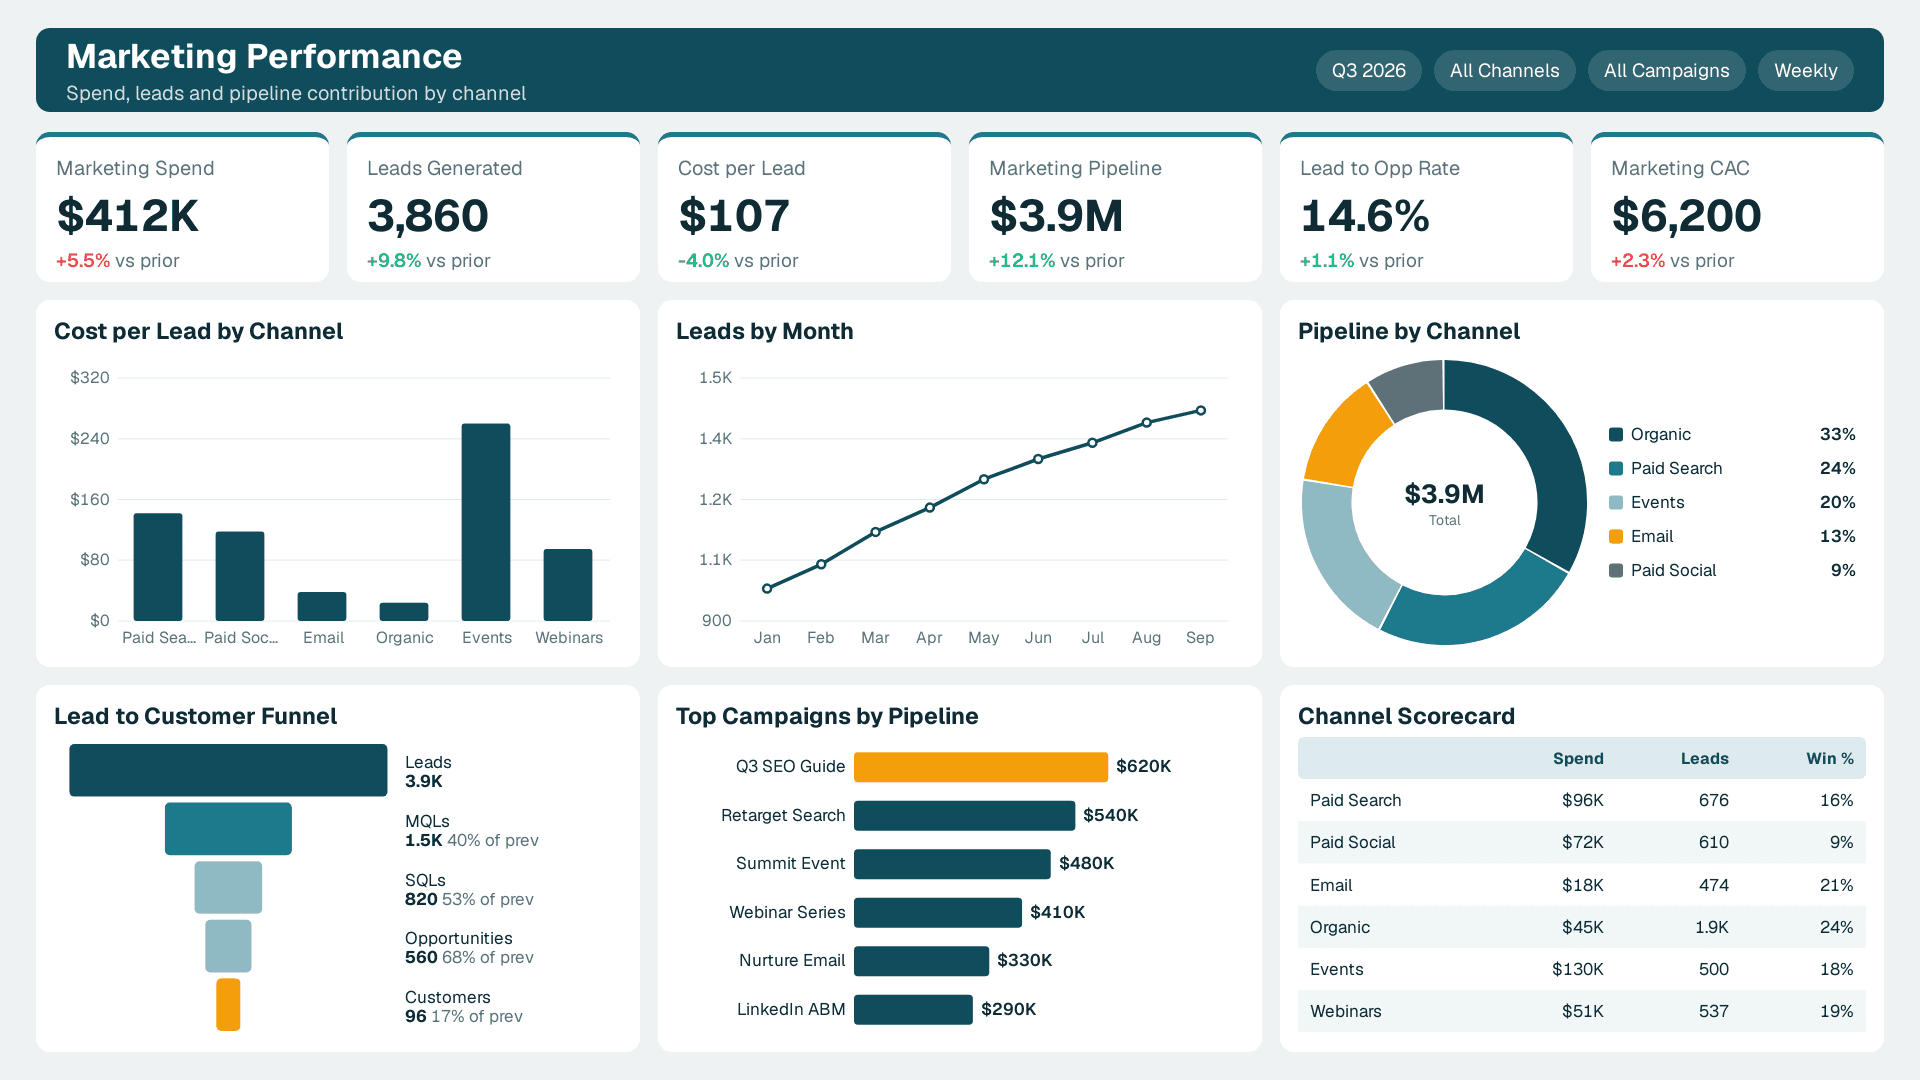
Decisions it supports: which channels get next quarter's budget, which campaigns to pause and whether marketing-sourced leads actually close.
Data it needs: ad platform exports, web analytics, form and lead data, and CRM opportunity data with a consistent source or campaign tag. Without shared tagging, the dashboard cannot link spend to revenue.
Best for: marketing managers and growth leads who report to a CFO or CEO and need to defend budget.
See a finished version: our marketing dashboard.
Pros:
- Forces one shared definition of a lead, which is useful on its own.
- Connects marketing activity to pipeline rather than vanity metrics.
- Quick to refresh weekly once connectors are set up.
Cons:
- Attribution is imperfect, and the dashboard can only be as honest as the tagging.
- Many connectors means more places for refreshes to break.
5. HR Hiring and Headcount Dashboard: Best for Workforce Planning
This example tracks open roles, time to hire, offer acceptance, headcount by department and attrition. Microsoft's Employee Hiring and History sample shows how to structure it.
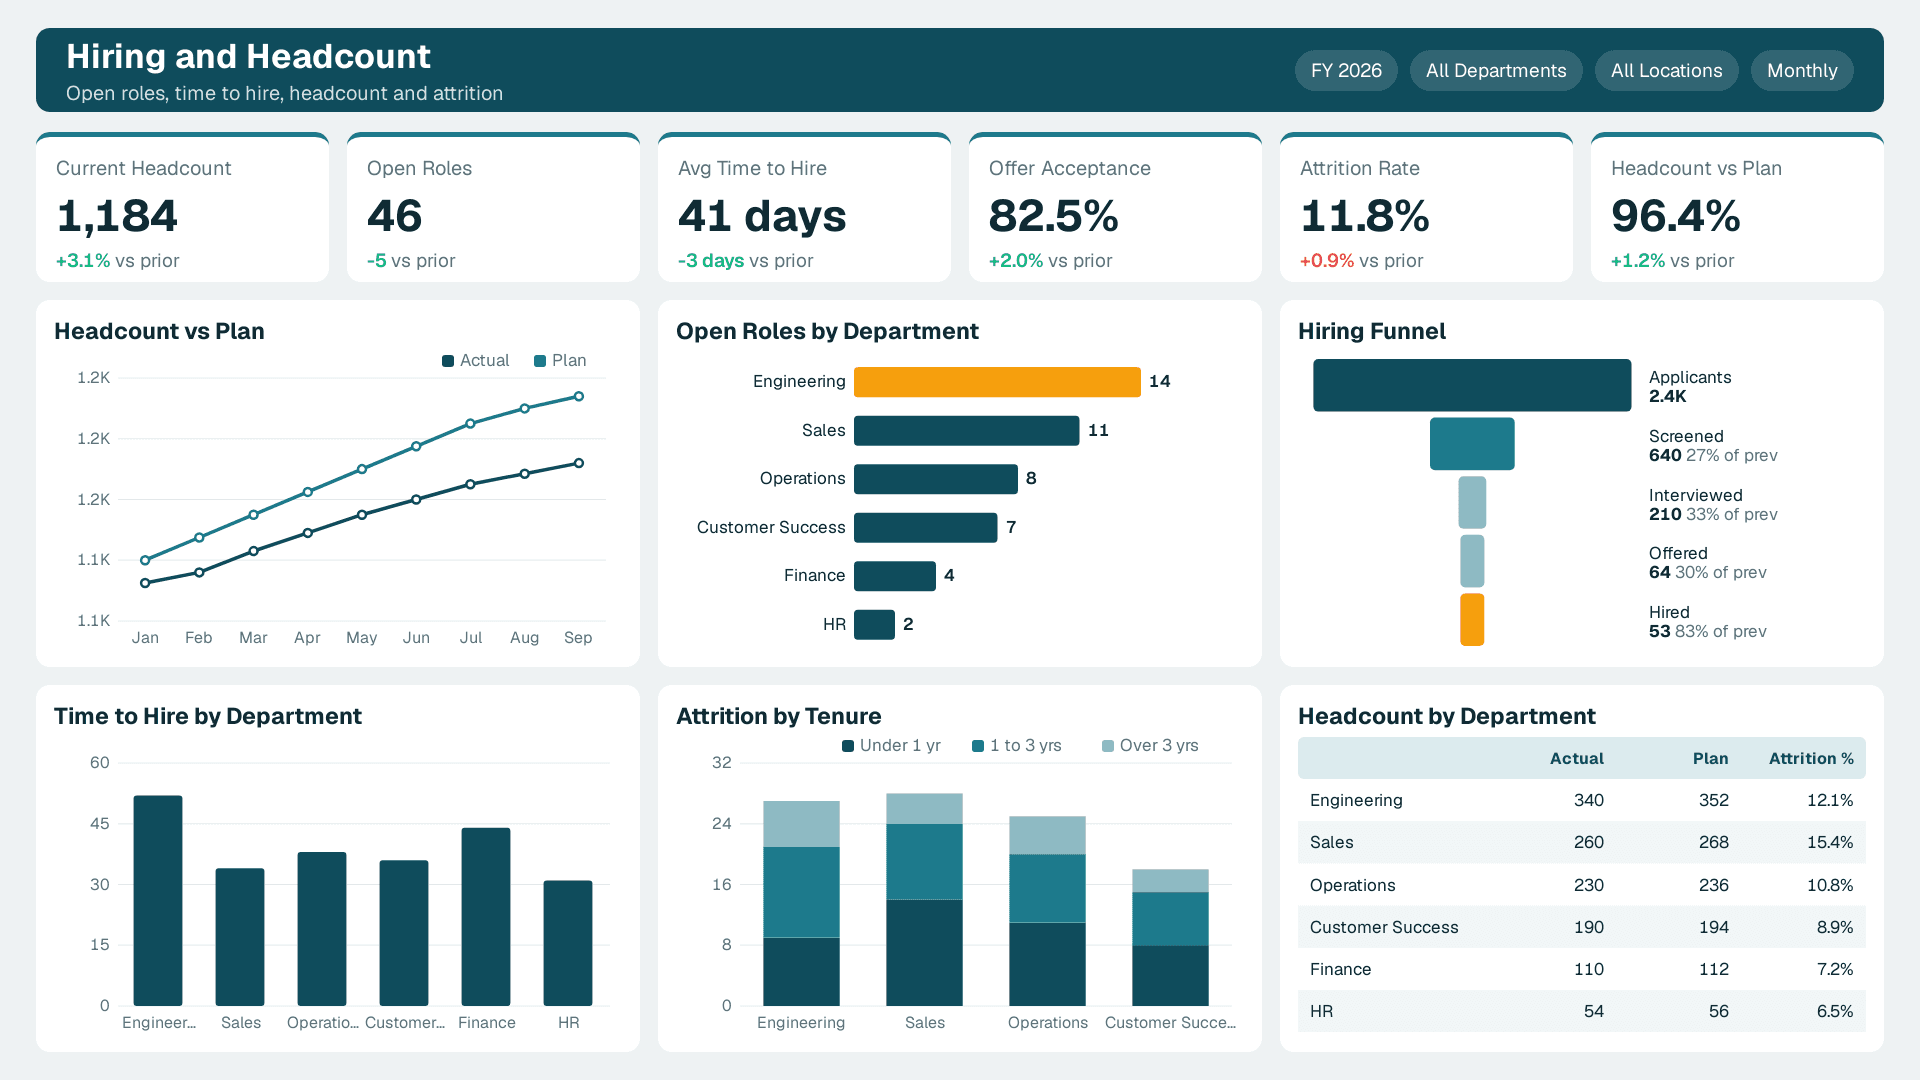
Decisions it supports: which roles to prioritise, where recruiting is slow, whether headcount matches plan and where turnover is concentrated.
Data it needs: an applicant tracking export, an HRIS employee table and an approved headcount plan. Access control matters because this data is sensitive.
Best for: HR leaders and finance partners aligning hiring with budget.
See a finished version: our HR dashboard.
Pros:
- Links people decisions to the finance dashboard through shared headcount.
- Small data volumes keep performance simple.
Cons:
- Row-level security needs careful design, since only the right people should see compensation or individual records.
- Smaller audience, so adoption is narrower than finance or sales.
6. AI-Assisted Analysis Page: Best Add-On Once the Basics Work
This is less a function and more a layer you add to the dashboards above. Microsoft's Artificial Intelligence sample brings together the Key influencers visual, the Decomposition tree and anomaly detection in line charts. These help a reader ask why a number moved without a new report. Microsoft also says Copilot can generate text summaries and narratives for a dashboard, for example explaining why sales spiked in a quarter. Copilot in Power BI needs a paid Fabric capacity of F2 or higher, or Power BI Premium P1 or higher. A Pro or PPU licence alone is not enough, and trial capacities are excluded. For a realistic view of what works, read Power BI Copilot Scenario Library: What Really Works in 2026.
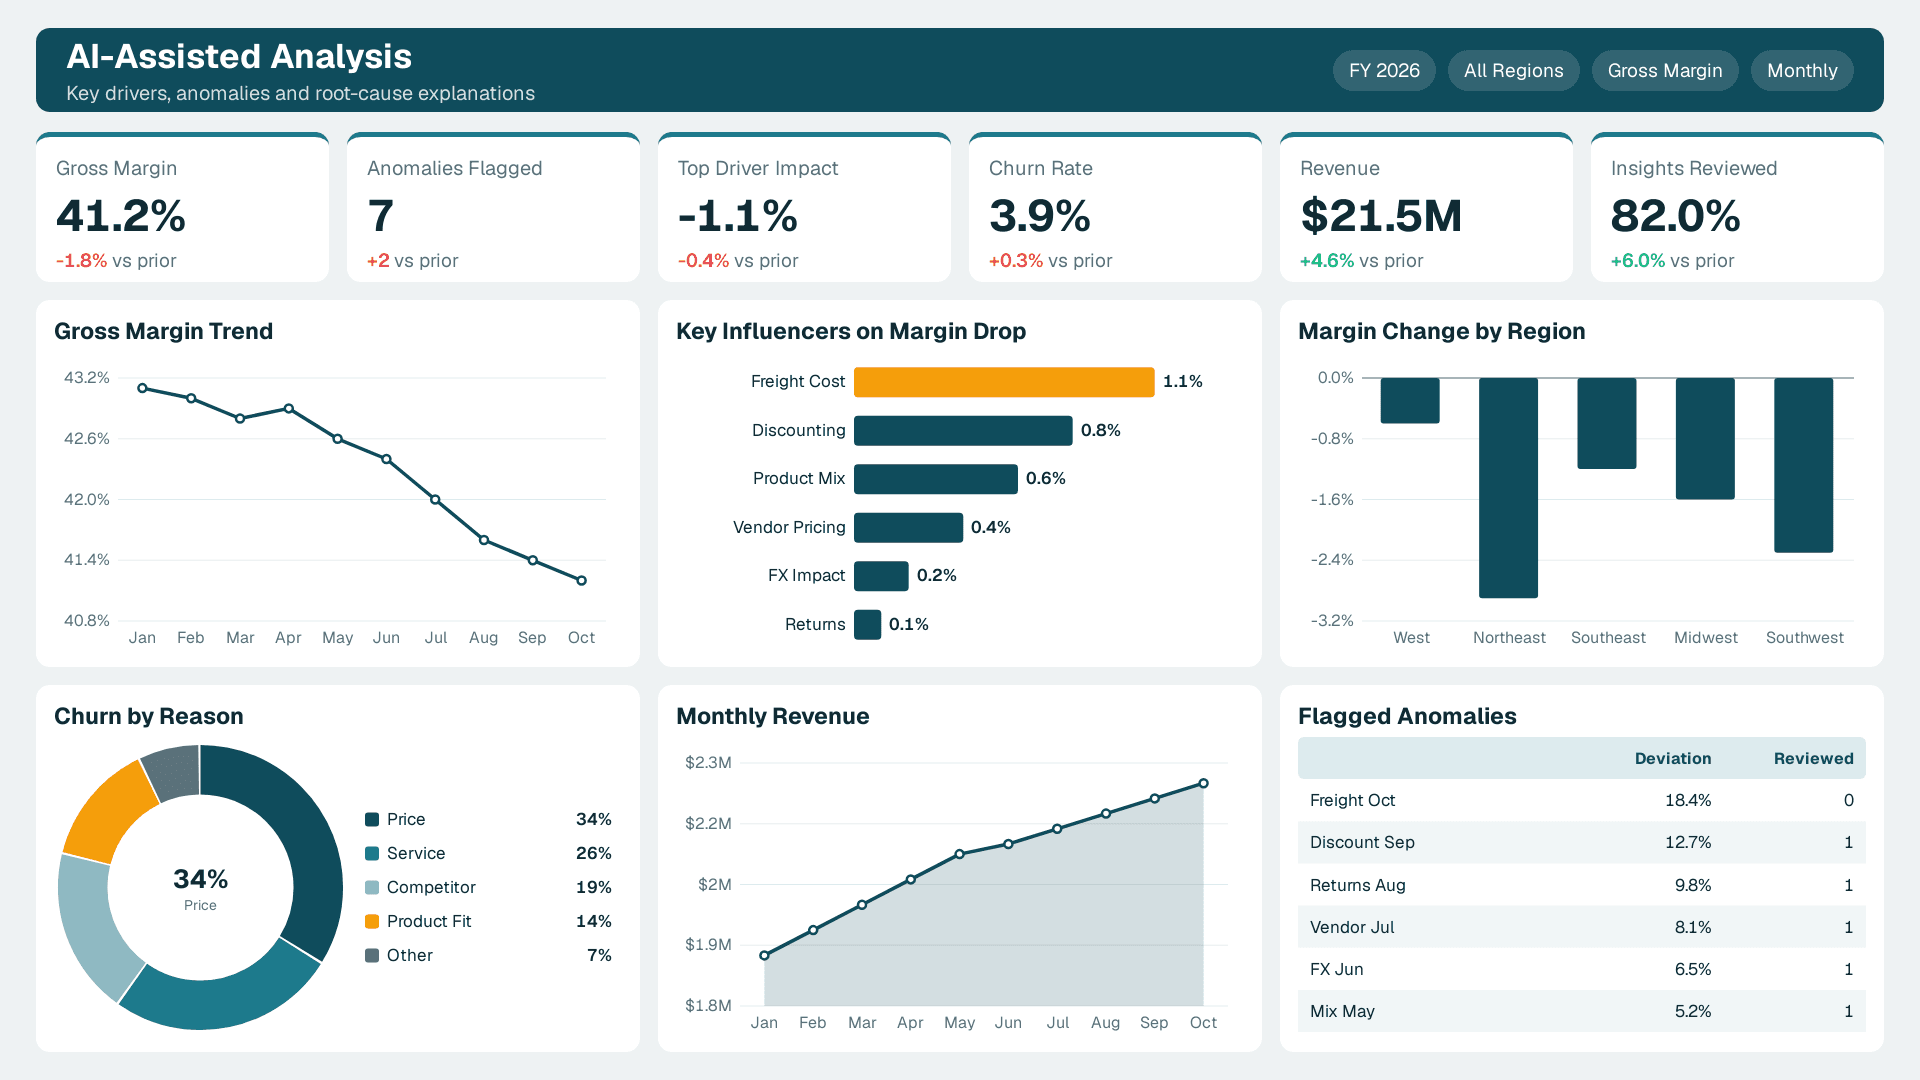
Decisions it supports: root-cause questions such as why margin dipped, what drives churn and which anomalies deserve a human look.
Data it needs: the same clean, well-modelled data as the dashboards underneath. AI features amplify data quality problems rather than hide them.
Best for: teams that already have trusted finance or sales dashboards and want faster explanations.
Pros:
- Shortens the gap between seeing a number and understanding it.
- Built-in visuals work without a data science team.
Cons:
- Copilot needs paid capacity, which changes the cost conversation.
- Explanations still need a human check before they reach a board pack.
Quick Comparison Table
| Rank | Dashboard | Core decision | Main data source | Build effort | Adoption likelihood |
|---|---|---|---|---|---|
| 1 | Finance spend and variance | Approve or freeze spend | General ledger, budget | Medium | High |
| 2 | Sales pipeline and revenue | Coach, forecast, prioritise deals | CRM | Medium | High |
| 3 | Operations and inventory | Reorder, reallocate, fix suppliers | ERP, warehouse | High | Medium |
| 4 | Marketing performance | Shift channel budget | Ad platforms, CRM, analytics | Medium | Medium |
| 5 | HR hiring and headcount | Prioritise roles, plan headcount | ATS, HRIS | Low | Medium |
| 6 | AI-assisted analysis page | Explain why a metric moved | Existing dashboard models | Medium | Medium |
How to Choose
- If you are new to Power BI: build finance first. The data is structured, the audience is senior and one win earns trust for everything else.
- If revenue is the pain point: start with the sales pipeline dashboard, but agree stage definitions before you write a measure.
- If cash is tied up in stock or suppliers: go straight to operations, and budget extra time for ERP extraction.
- If leadership questions marketing spend: build the marketing dashboard only after CRM tagging is consistent.
- If licensing is unclear: a Pro seat is $14 per user per month and Premium Per User is $24, but sharing broadly or using Copilot changes the answer. Microsoft also states that Power BI licences are not exclusive and can be mixed and matched. See Power BI Pro vs PPU vs Fabric: Which Licence You Need before you commit.
What Are the Types of Dashboards in Power BI?
In practice, buyers meet three types. Operational dashboards track live or daily activity, like inventory and fulfilment. Analytical dashboards let people explore causes, like the decomposition and key influencer views. Strategic or executive dashboards summarise a handful of KPIs for leadership, like the finance and sales views above. Most good implementations mix all three, with an executive page on top and drill-through detail underneath.
Is Power BI Basically Excel?
No. Excel is a flexible spreadsheet for individual analysis. Power BI is built around a shared data model, scheduled refresh and governed sharing, so many people see the same numbers. Many teams keep Excel as a data source and add Power BI on top. For a deeper comparison, read How Power BI Is Different From Excel.
Ready to Turn a Sample Into Your Own Dashboard?
Opening a power bi dashboard sample is easy. Making it reconcile to your ledger, refresh reliably and get used every week is the hard part. If you want a scoped plan for your first two dashboards, talk to our Power BI consulting team.
---
About Lets Viz: Lets Viz is a data analytics consultancy that has served clients since 2020, building Power BI dashboards and managed reporting for mid-market teams across finance, healthcare, retail and professional services. We hold a 5.0 rating on Clutch and focus on dashboards that reconcile to source systems and get used.
Sources
- Microsoft Learn: Power BI sample reports and datasets
- Microsoft Fabric: Power BI data visualization features
Facts and prices checked November 2026.