How Power BI is different from Excel?

Tools that enable speedy, intuitive data analysis and database transformation into intelligible information are essential in today’s corporate environment. Companies are becoming increasingly aware of the value of data analysis and how it relates to enhancing performance and boosting profitability. To ensure that professionals get the most out of their job, it is crucial to use the appropriate equipment. Excel and Power BI are the two most widely used data analysis programs worldwide, but which one is superior?
Although they offer different features, Microsoft’s Excel and Power BI are both used for data processing and analysis.
Office 365’s Excel, released in 1985, is widely used. Whether you are a data analyst or not, you have probably used Microsoft Excel. The spreadsheet-like program quickly computes and performs mathematical operations by dividing data into rows and columns. Like Power BI, it visualizes data.
Power BI is a suite of business intelligence tools, software, and services. Power BI, unlike Excel, is designed for corporate data processing. Power BI can connect with Excel spreadsheets, relational and non-relational databases, cloud services, files in many formats, Big Data tools, internet applications, and more. Reports, dashboards, and customizable, stunning, interactive, and easy visualizations have significant graphic and data transformation capabilities.
Excel and Power BI have many similarities since they both extract and visualize data. Each Excel and Power BI update adds new features and possibilities.
What’s different? Start with each application’s pros and cons.
Before we begin, let’s clarify that the features and functionalities outlined below pertain to end users’ app usage. We’re also talking about Excel’s traditional edition, not the Power modules that give Excel access to Power BI’s more advanced capabilities.
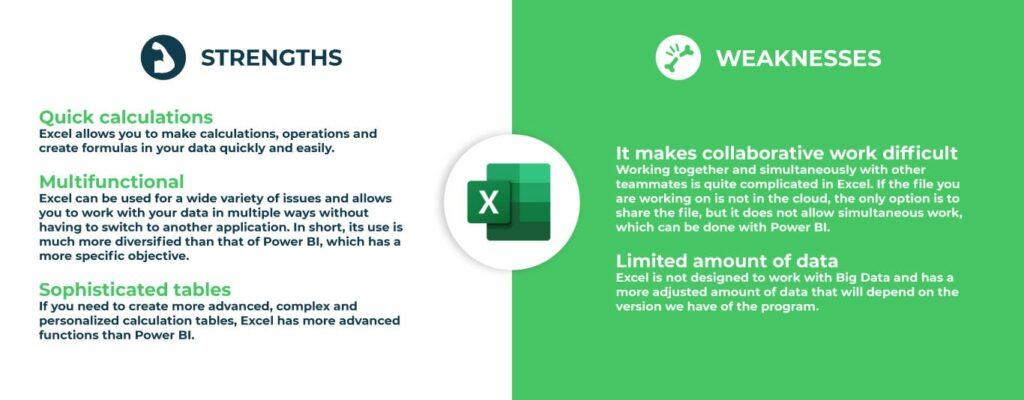
Excel: Strengths and Weaknesses
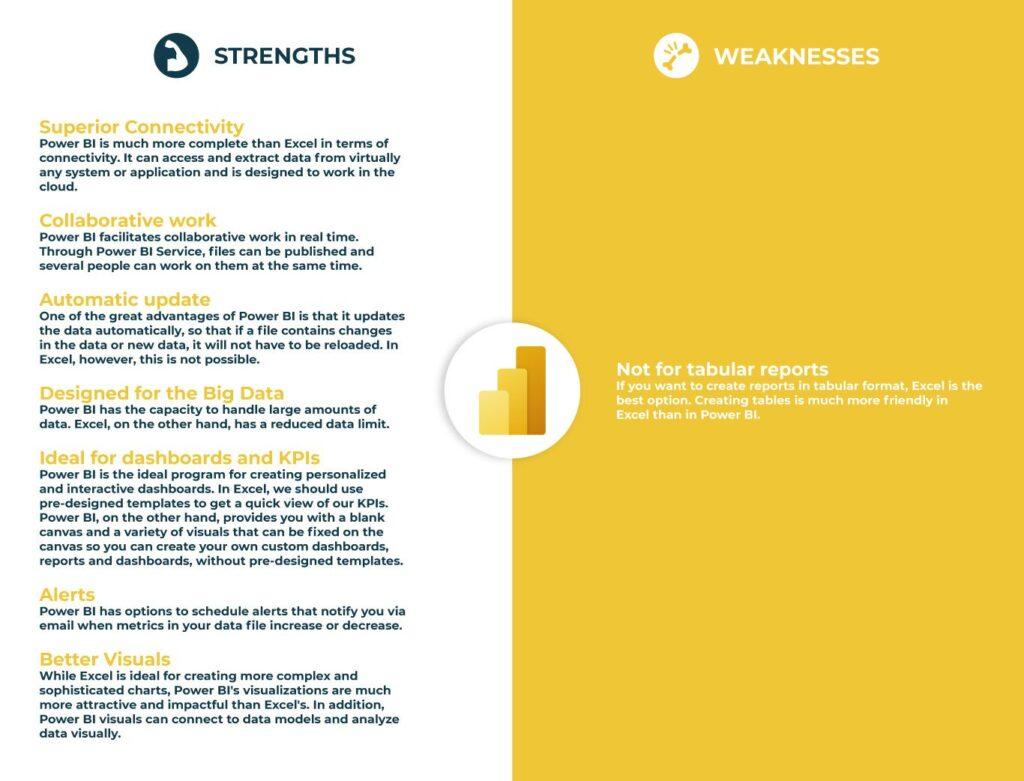
Power BI: Strengths and Weaknesses
Principal differences between Excel and Power BI
- Excel is used for data organization, transformation, and mathematical computations. Power BI, on the other hand, was designed as a business intelligence and data visualization tool.
- Excel has constraints regarding the quantity of data it can process. In comparison, Power BI can manage far more data.
- Power BI can connect to a huge number of data sources, but Excel has a restricted connection capability. In addition, unlike Excel, Power BI is readily accessible from mobile devices.
- Excel has a slower processing speed than Power BI.
- Power BI dashboards are more aesthetically pleasing, interactive, and configurable than Excel dashboards.
- Power BI is a more effective tool than Excel for comparing tables, reports, and data files.
- Excel is more user-friendly and simpler to use than Power BI.
Conclusion
After extensive analysis, Excel and Power BI are full data processing systems. They are distinct.
Since their potential depends on your data needs, comparing tools is risky. Excel is superior for manipulating data, searching, calculating, using mathematical formulae, and creating complicated tabular reports. Power BI is better for Big Data, visualizations, teams, data integration, and data analysis to collect indications, draw conclusions, and make data-driven choices.
Excel provides greater data manipulation than Power BI. Thus, it offers more features and is excellent for skilled data analyzers.
Power BI, on the other hand, is a fuller tool and excellent for enterprises and industries that need to analyze big volumes of data in a straightforward manner, work collaboratively, turn data into insights, update data frequently, and show information aesthetically.
As you can see, business intelligence has a lot to offer businesses of all sizes across all industries. If you’re not already using BI in your decision-making process, now is the time to start!
Check out other helpful Power BI Blogs

If you are looking forward to getting your data pipeline built and setting up the dashboard for business intelligence, book a call now from here.
#analytics #data #business #artificialintelligence #machinelearning #startup #deeplearning #deeplearning #datascience #ai #growth #dataanalytics #india #datascientist #powerbi #dataanalysis #businessanalytics #businessanalyst #businessandmanagement #dataanalyst #businessanalysis #analyst #analysis #powerbideveloper #powerbidesktop #letsviz