Interactive Power BI Dashboards: Real-Time Data at Your Fingertips
Say goodbye to data chaos and hello to clarity with our intuitive Power BI dashboards. Simplify complex information, uncover patterns, and drive strategic decision-making with ease. Navigate the twists and turns of your business journey with our insightful Power BI dashboards. From forecasting to trend analysis, our dashboards provide the roadmap to success.
Trusted by teams across 15+ countries
Power of Let's Viz Power BI dashboards
Tailored Insights
Scalability and Flexibility
Enhance Collaboration
Improved Decision-Making
Cost-Effective
Tailored Insights

How can our Power BI dashboards enhance your business performance?
Tailored Insights
Custom dashboards are designed to meet the specific needs of your business. They allow you to focus on the metrics that matter most to you, providing insights that are directly relevant to your goals.
Real-Time Data Visualization
With Power BI, you can access real-time data visualizations that keep you up-to-date with the latest trends and performance indicators. This enables quick decision-making based on current information.
Improved Decision-Making
By visualizing data in a clear and concise manner, Power BI dashboards help you understand complex data sets. This leads to better, data-driven decisions that can propel your business forward.
Enhance Collaboration
Power BI dashboards can be shared easily with team members, promoting collaboration and ensuring that everyone is on the same page. This fosters a data-driven culture within your organization.
Scalability and Flexibility
As your business grows, your data needs will evolve. Custom Power BI dashboards are scalable and can be adjusted to accommodate new data sources and changing business requirements.
Cost-Effective
Investing in custom dashboards can save money in the long run by reducing the need for multiple analytics tools and minimizing manual data processing efforts.
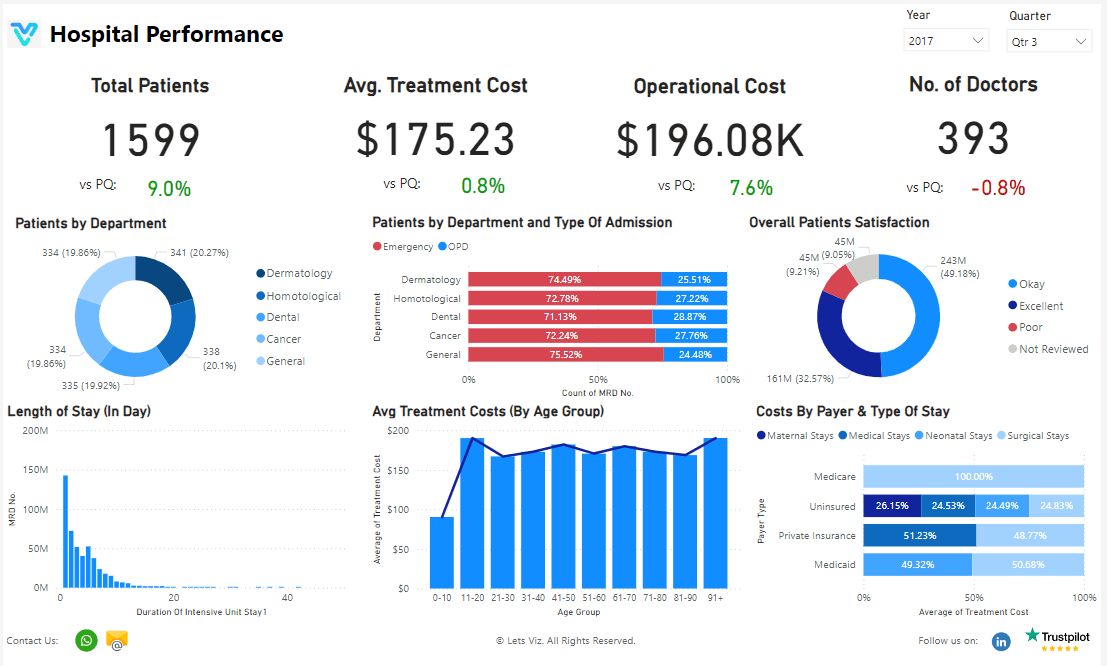
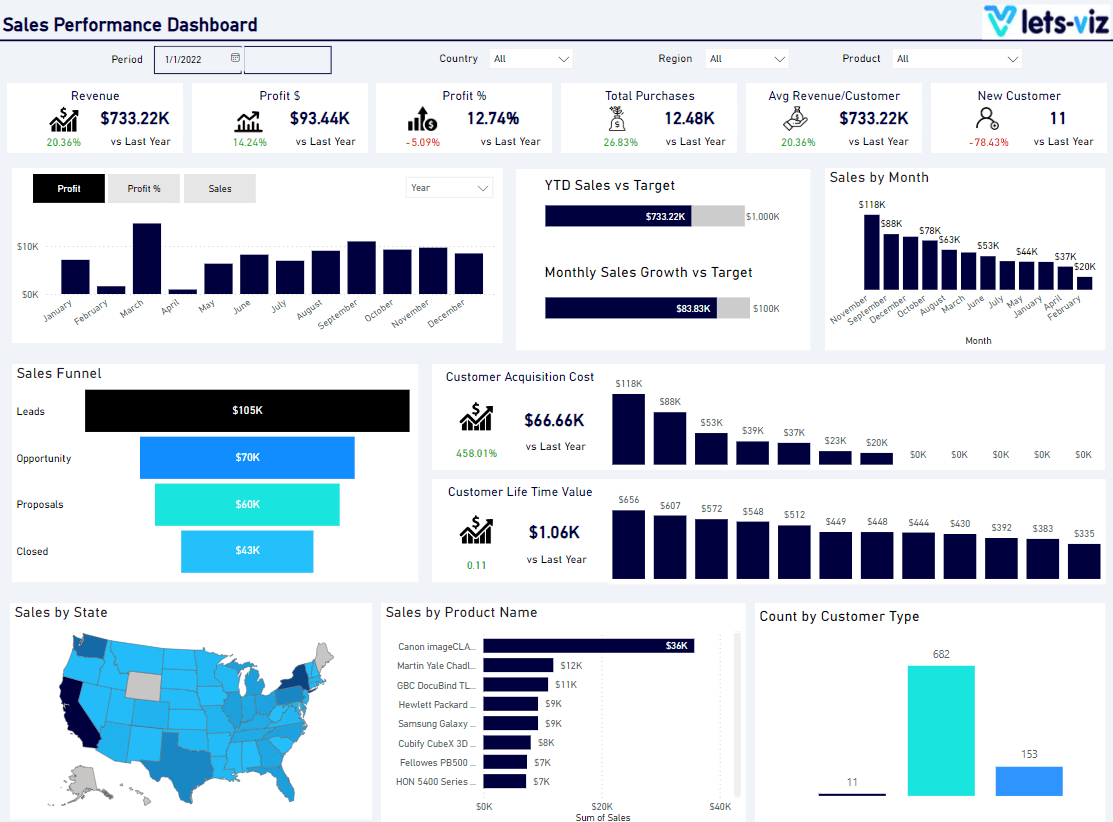
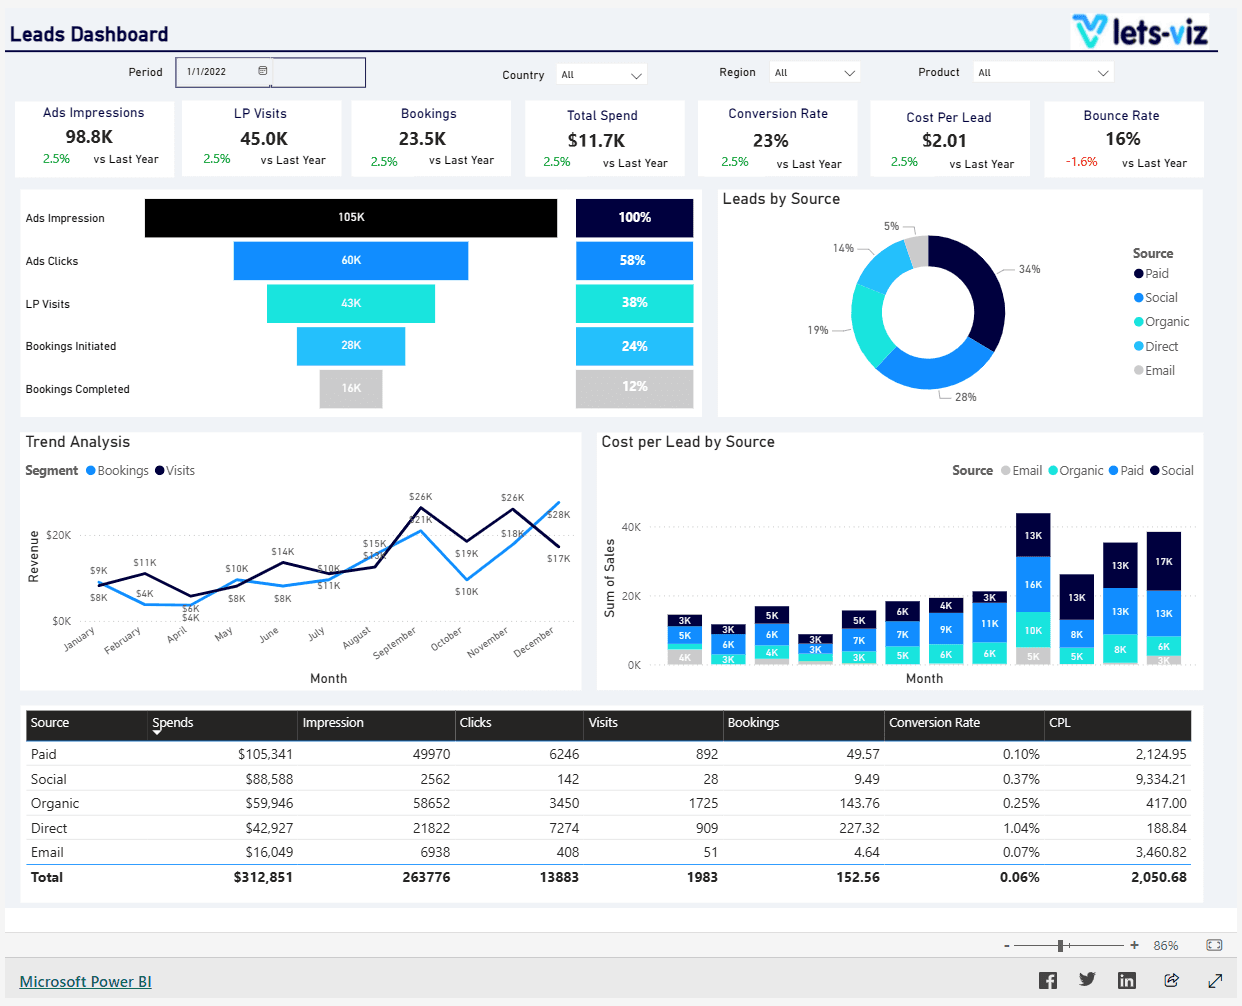
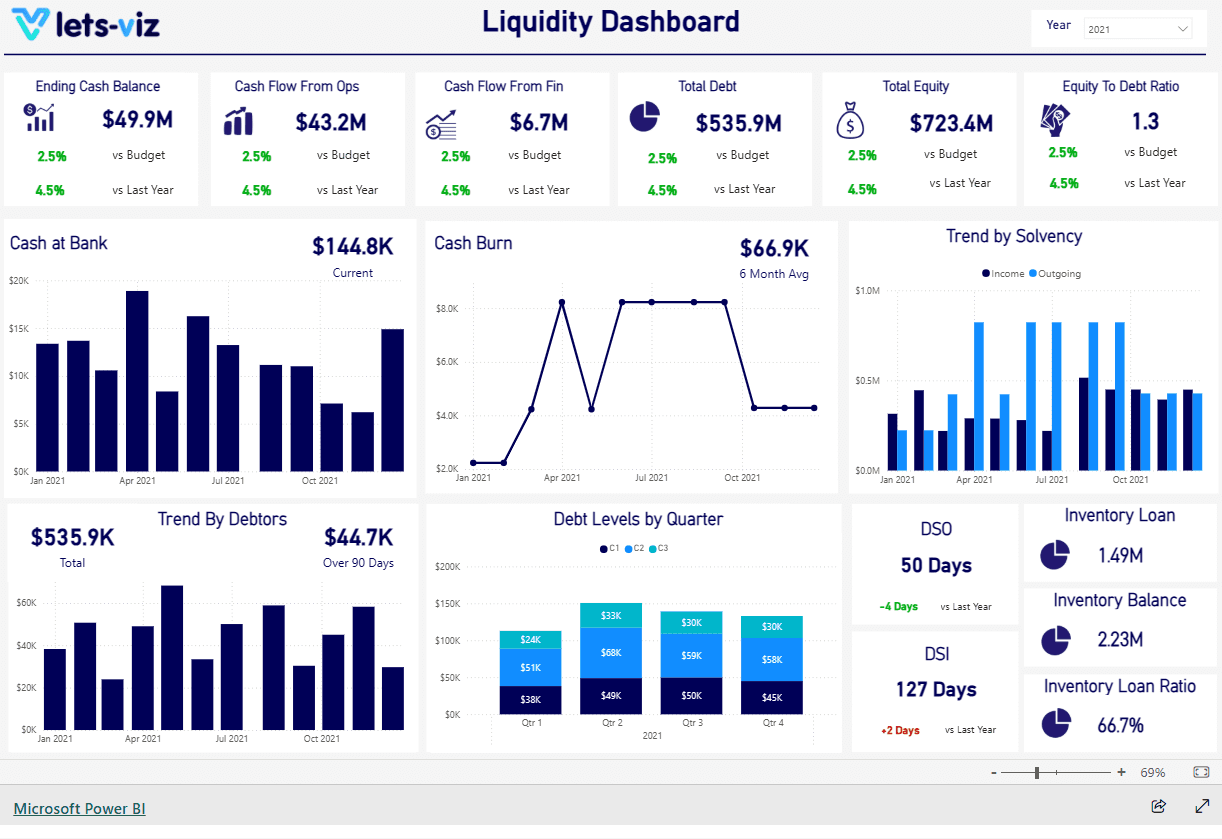
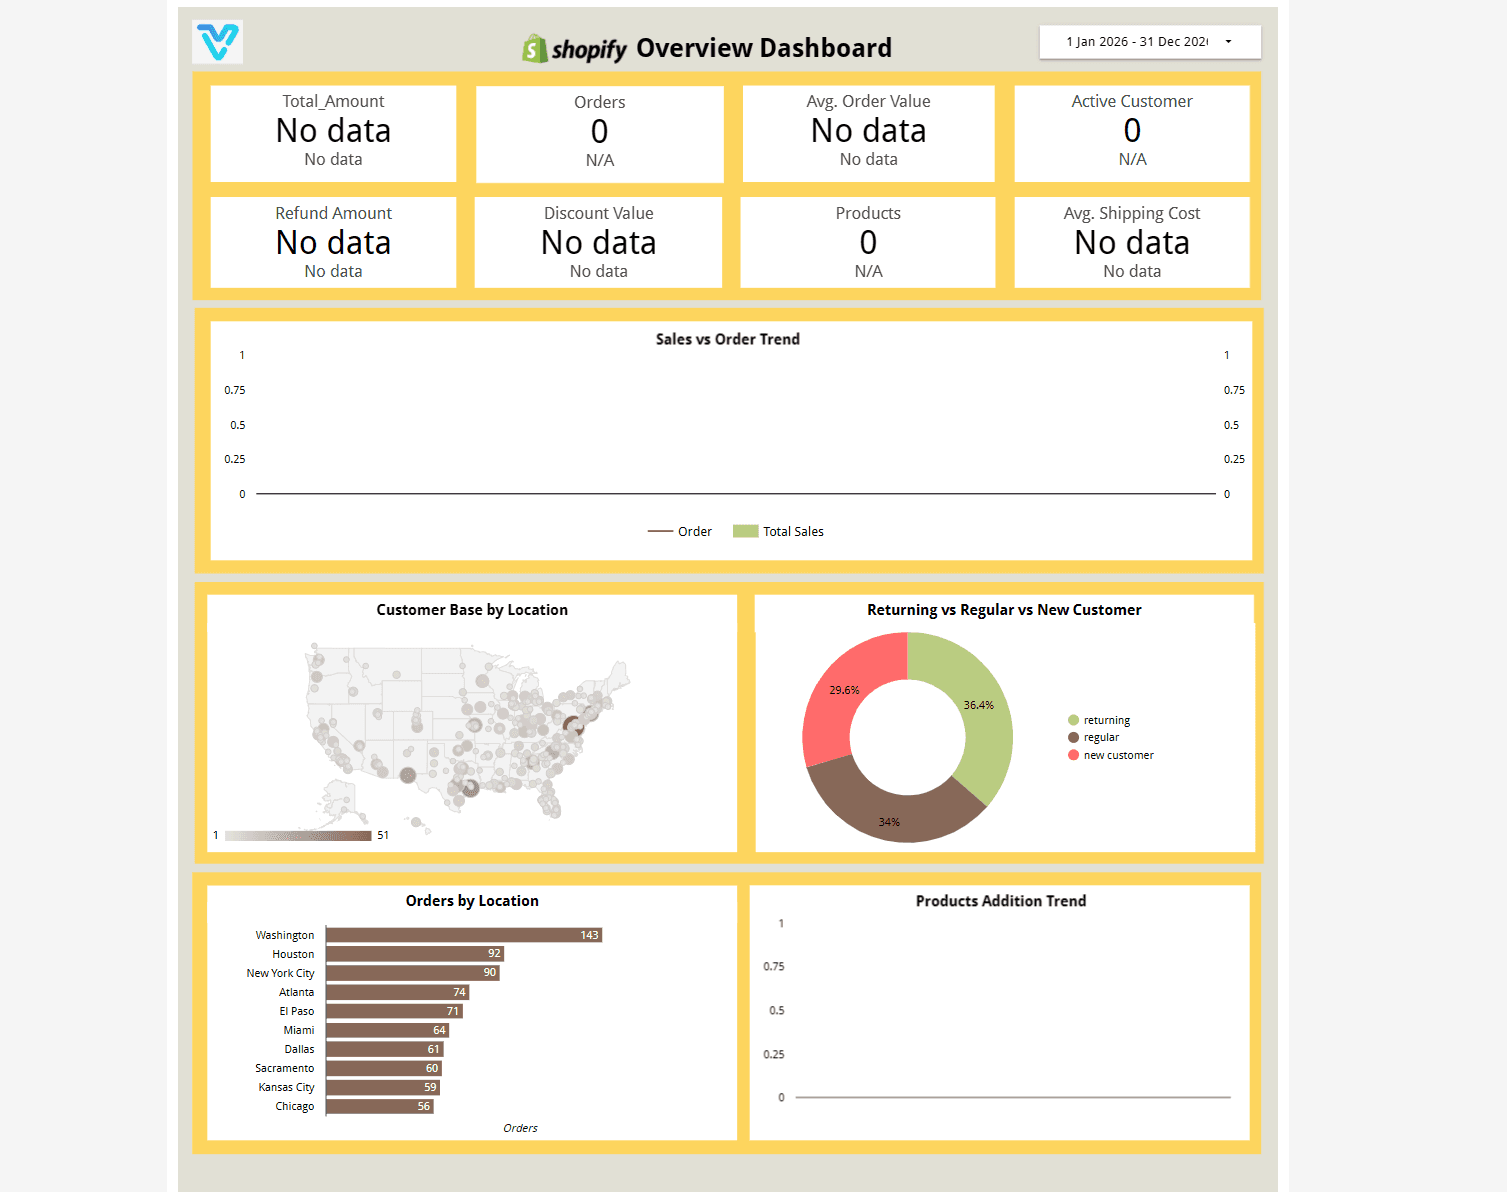
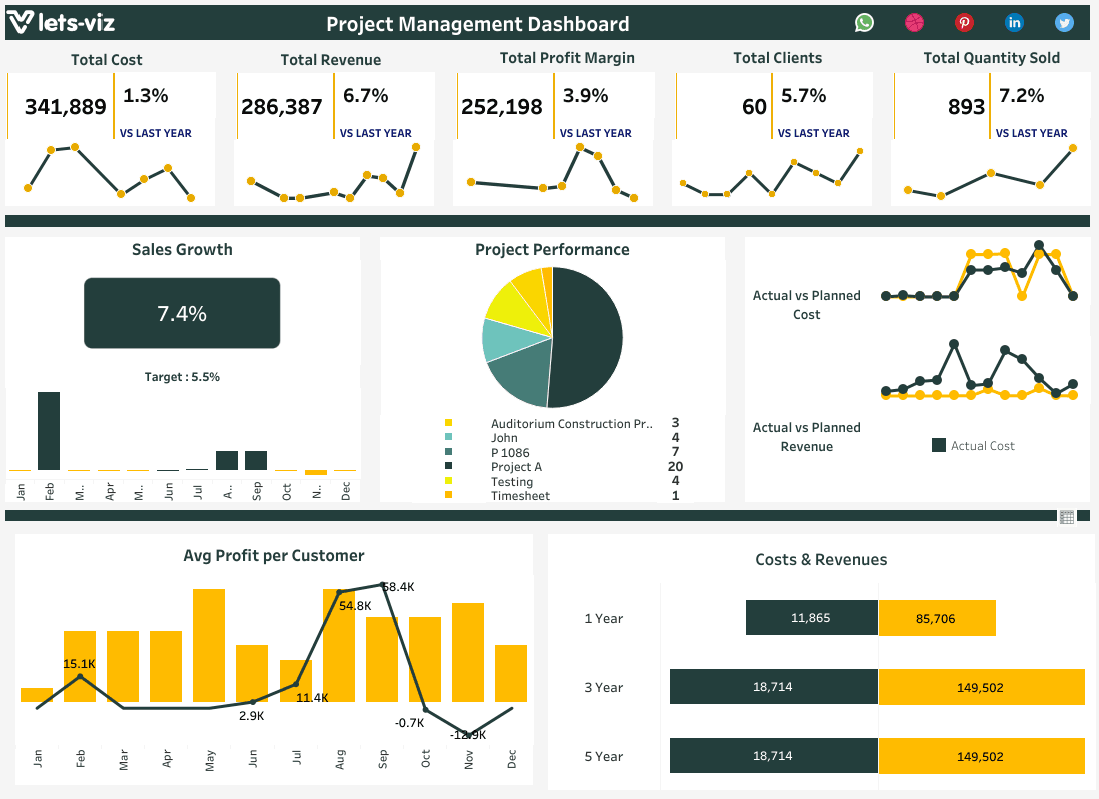
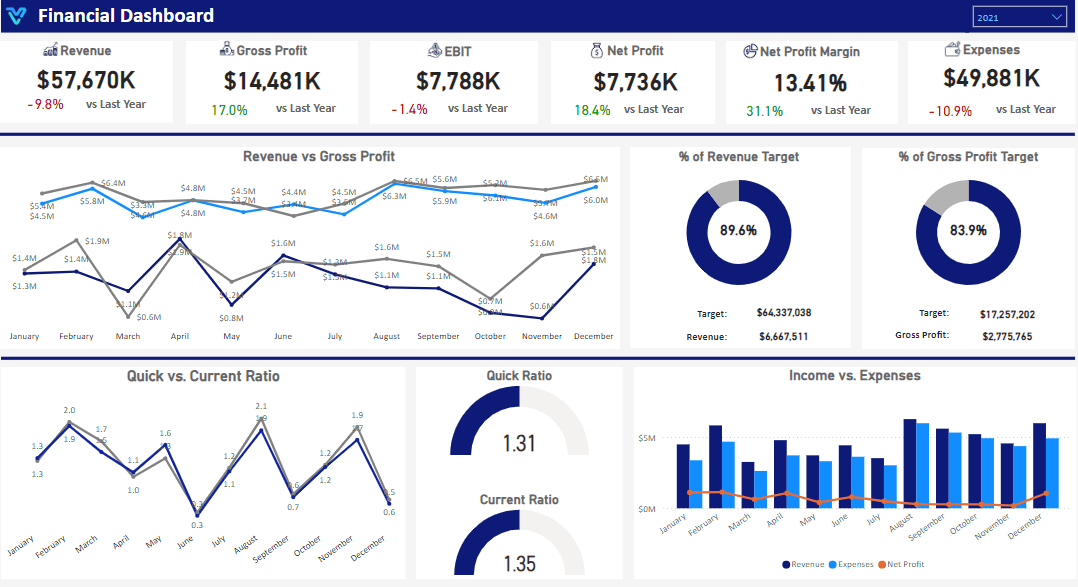
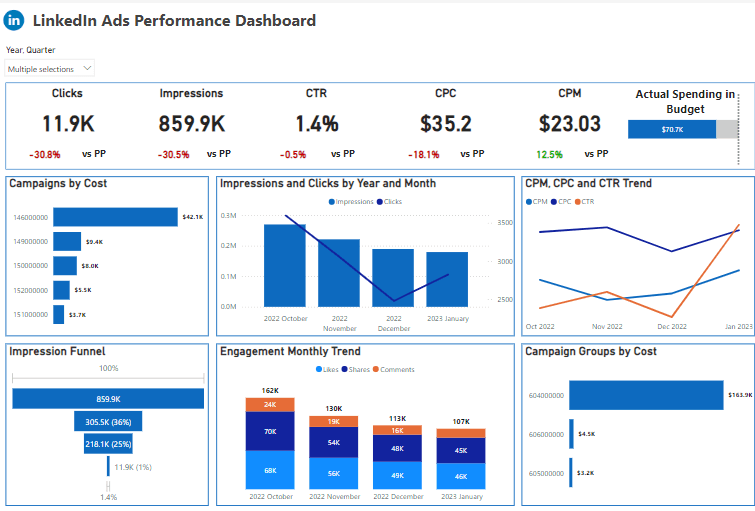
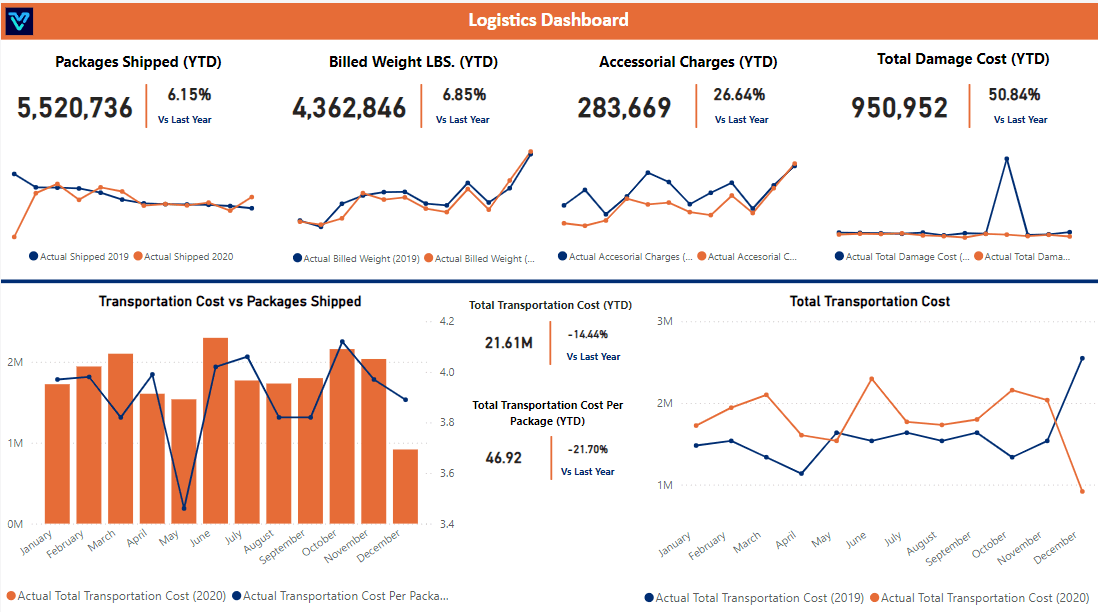
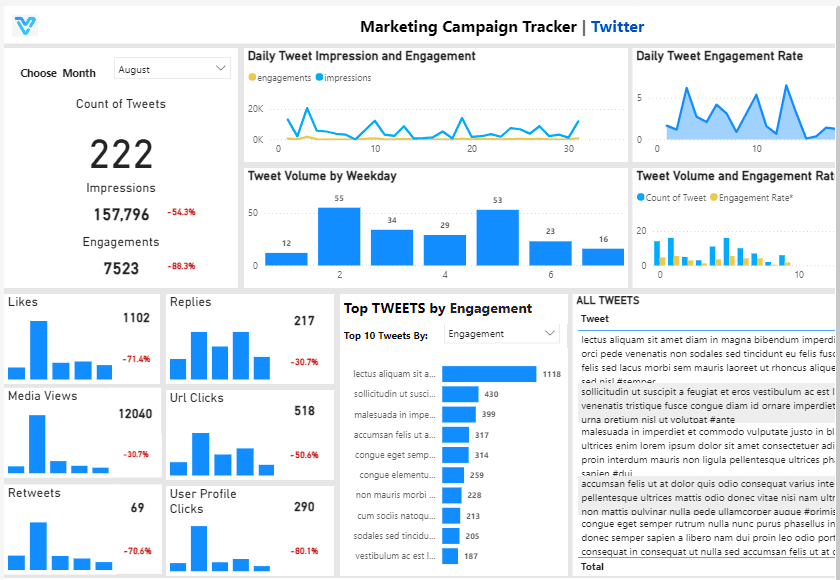
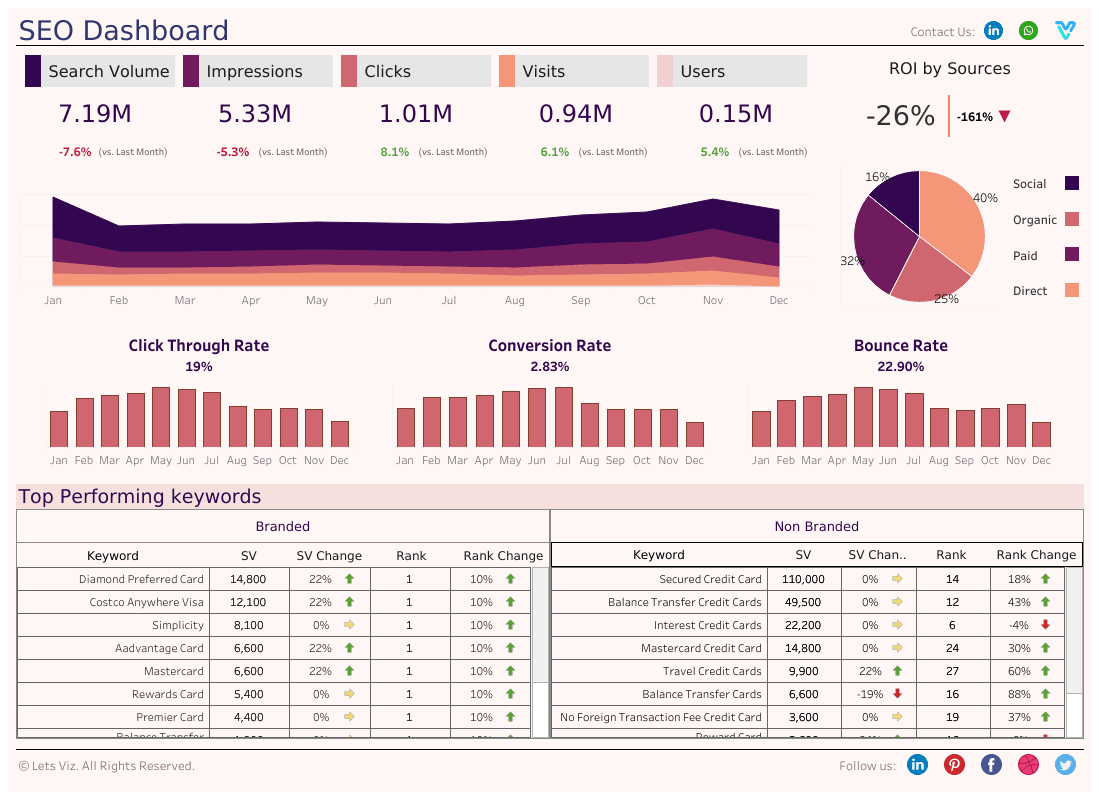
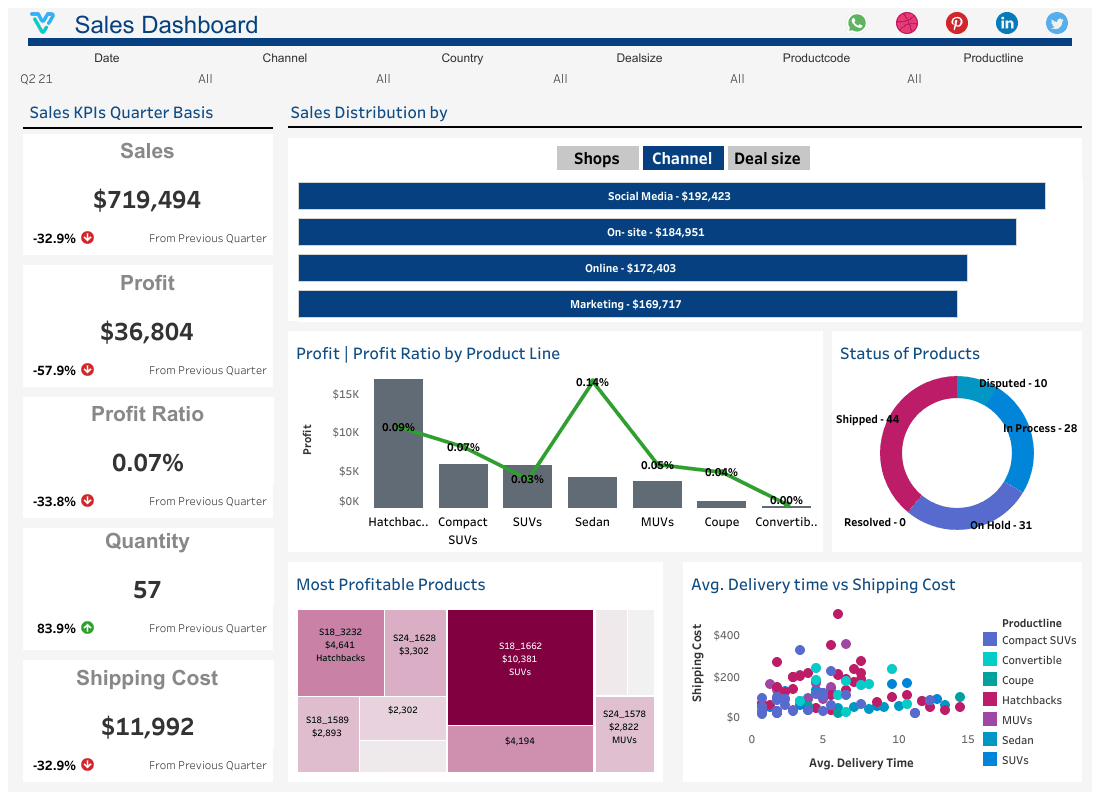
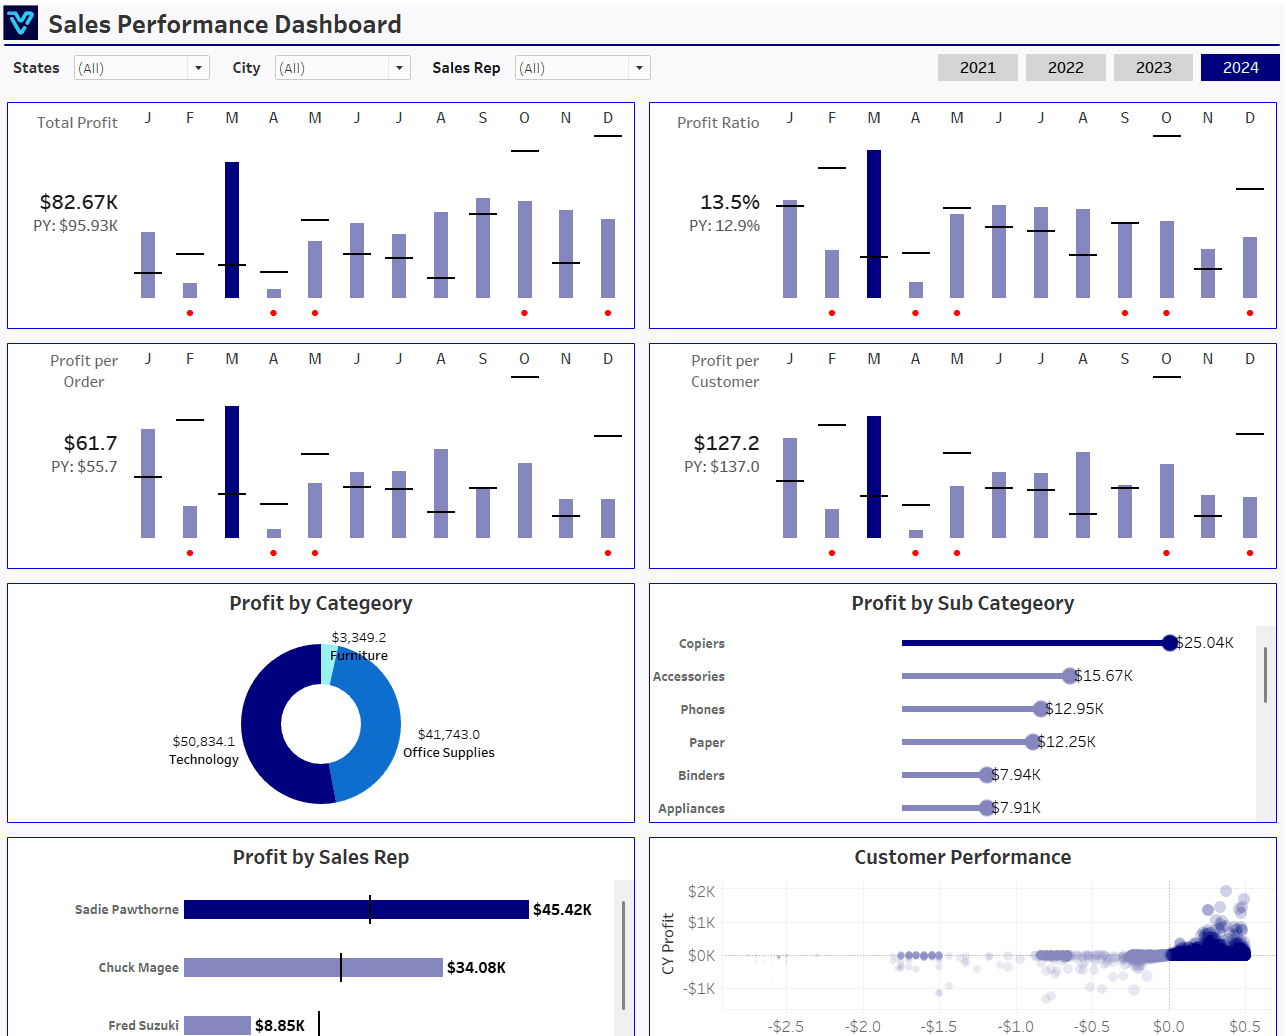
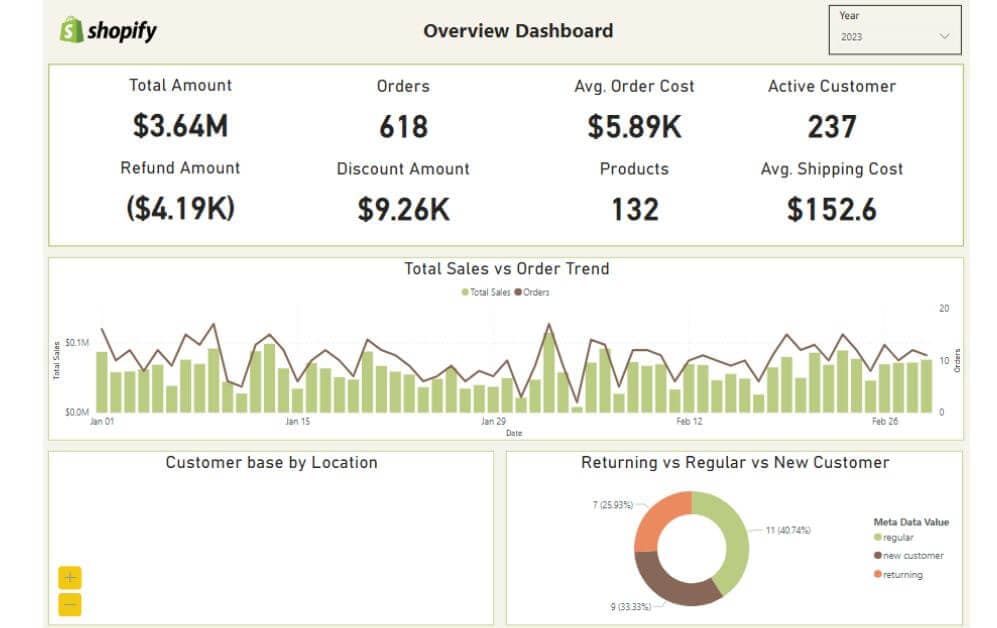
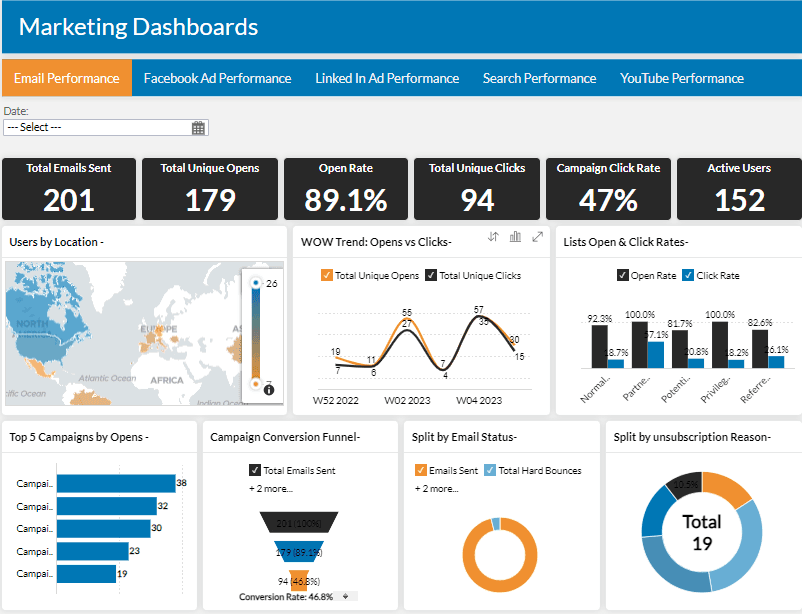
Checkout Our Insightful Power BI Dashboard Examples
Explore dashboard examples by department, industry, and tool — then request a similar build.
Elevate Your Business Intelligence with Stunning KPI's
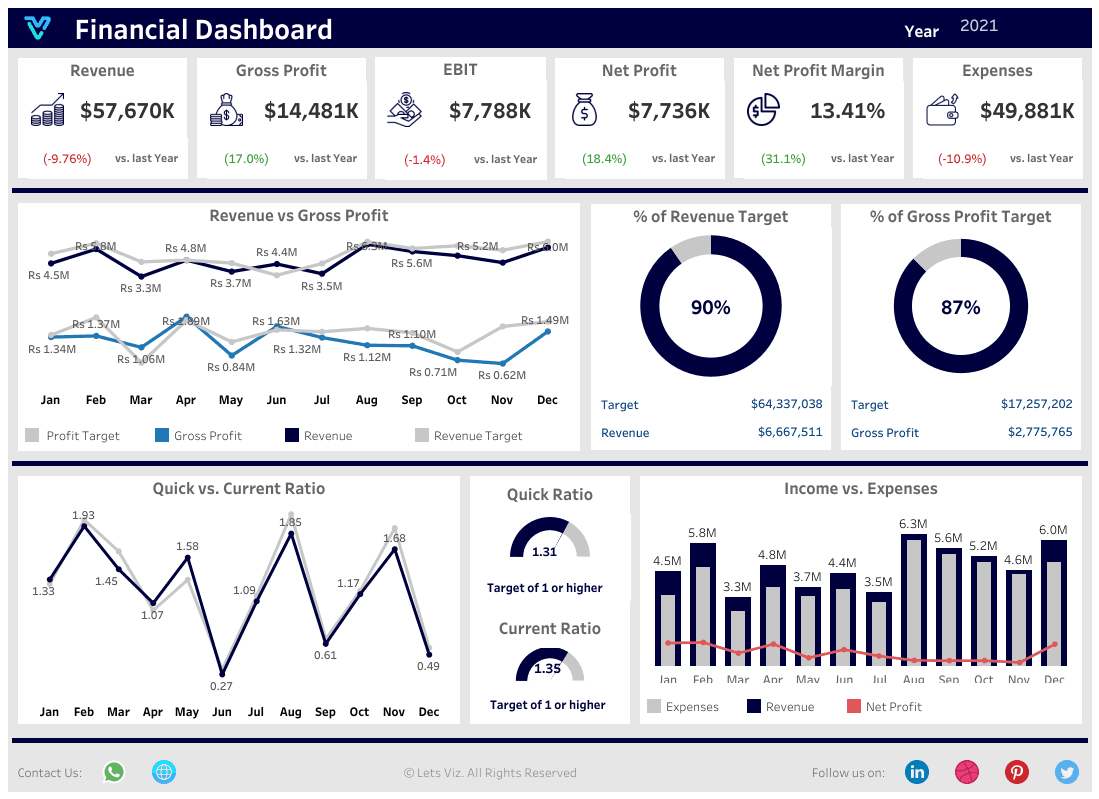
Sales Revenue Growth Rate
Track the percentage increase or decrease in sales revenue over a specified period. Monitoring revenue growth rate helps assess business performance, identify trends, and evaluate the effectiveness of sales strategies.
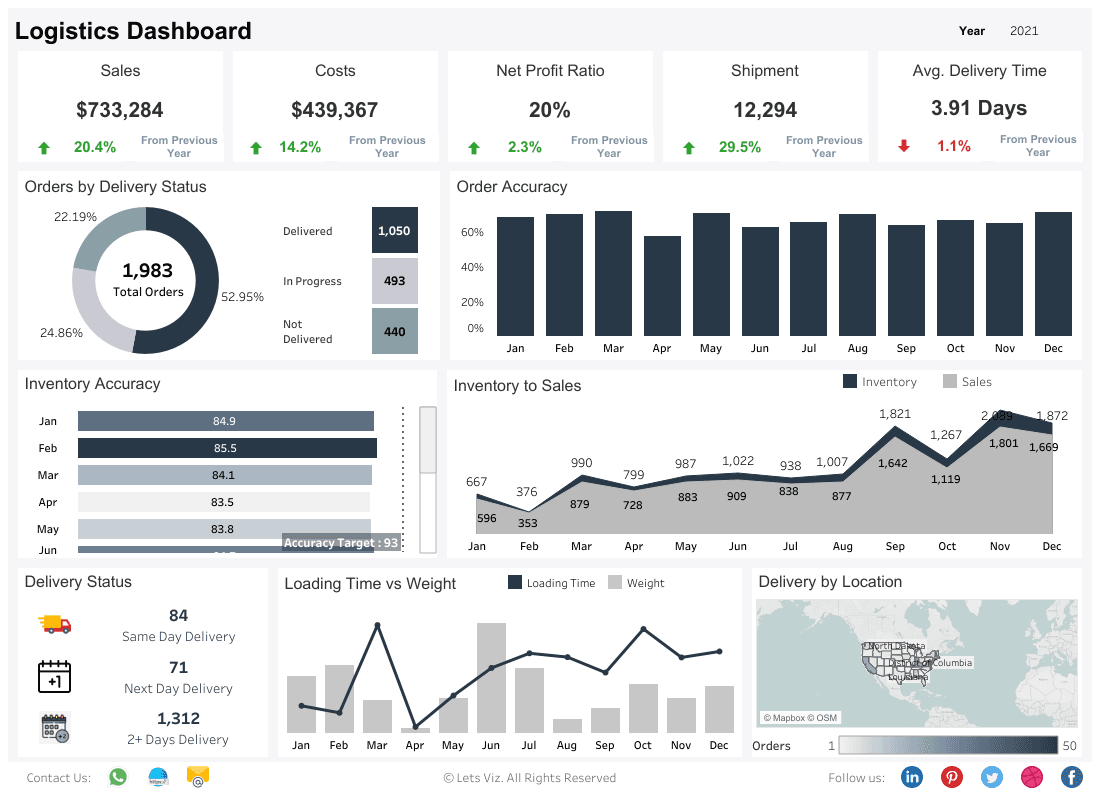
Inventory Turnover Ratio
Measure how quickly inventory is sold and replaced within a specific time period. Monitoring inventory turnover ratio helps optimize inventory management, minimize carrying costs, and prevent stockouts or overstock situations.
Customer Lifetime Value (CLV)
Calculate the total revenue generated by a customer throughout their relationship with your business. CLV helps prioritize customer segments, tailor marketing strategies, and enhance customer retention efforts.
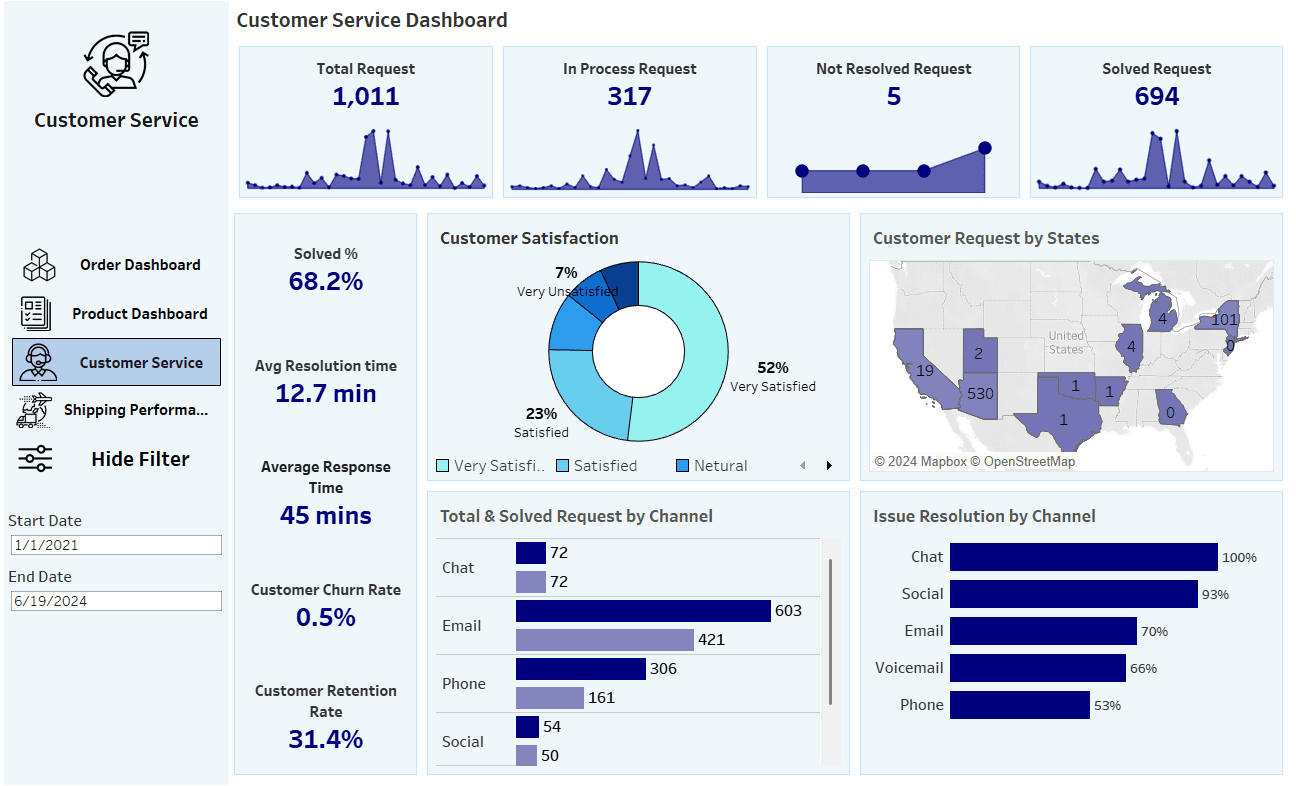
Churn Rate
Determine the percentage of customers who stop using your product or service within a given time frame. Monitoring churn rate helps identify factors contributing to customer attrition and implement strategies to reduce churn.
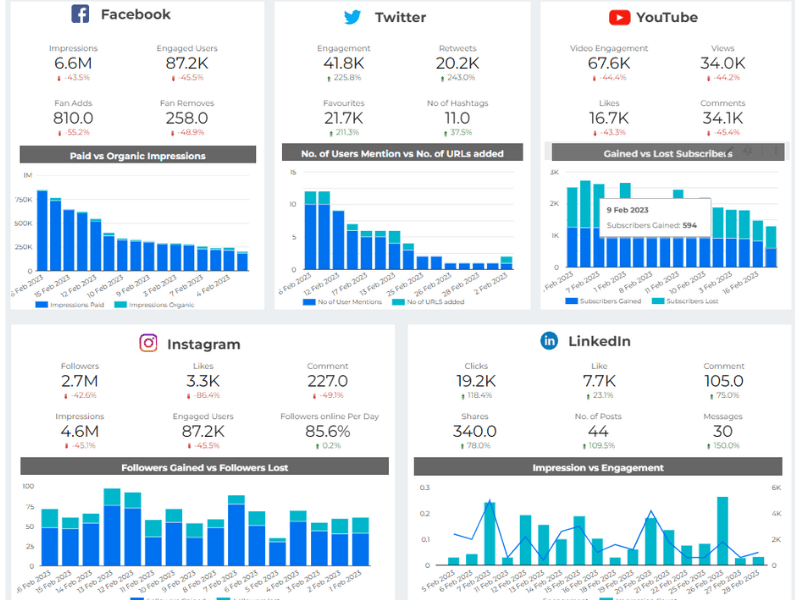
Social Media Engagement
Evaluate the level of interaction and involvement your brand receives on social media platforms. Monitoring engagement rate helps assess content effectiveness, build brand awareness, and foster community engagement.
Customer Acquisition Cost (CAC)
Measure the average cost to acquire a new customer. Understanding CAC helps optimize marketing and sales efforts, allocate resources efficiently, and improve overall profitability.
Average Order Value (AOV)
Calculate the average amount spent by customers in a single transaction. Analyzing AOV helps identify cross-selling and upselling opportunities, optimize pricing strategies, and maximize revenue per customer.
Customer Acquisition Cost (CAC)
Measure the average cost to acquire a new customer. Understanding CAC helps optimize marketing and sales efforts, allocate resources efficiently, and improve overall profitability.
Customer Lifetime Value (CLV)
Calculate the total revenue generated by a customer throughout their relationship with your business. CLV helps prioritize customer segments, tailor marketing strategies, and enhance customer retention efforts.
Customer Retention Rate
Calculate the percentage of customers retained over a specified period, excluding new customer acquisitions. Monitoring retention rate helps gauge customer loyalty, reduce churn, and increase customer lifetime value.
Wondering what this would cost you?
Answer a few questions and see an honest price range on screen — no email, no call needed.
Frequently Asked Questions
Find answers to common questions about our services and process.

Helping companies make data-driven decisions to achieve their Goals
Experience superior data analysis with our custom dashboards. Specializing in all tools and technologies, we turn data into visually compelling, actionable insights