Total Email Sent
480K
▲ The number of emails dispatched, indicating the scale of your email campaigns.
A marketing dashboard gives leadership and channel owners a single view of spend, CPL, CTR, CVR, ROAS, pipeline and revenue across SEO, PPC, Social, Email and GA4 . On this page you’ll find the core KPIs , a simple framework for exec vs. channel views, and real examples you can deploy in Looker Studio, Zoho Analytics or Power BI . Want it built and automated for you? Marketing Dashboard & Reporting Automation Service .
Track spend, CPL, CTR, CVR, ROAS, pipeline, and revenue across channels in one live marketing view.
Built for marketing teams with cross-channel KPI tracking and campaign drill-down analysis.
Trusted by teams across 15+ countries
Explore the core marketing dashboard views built for campaign and leadership decisions.
Interactive marketing reporting view.
Open the live embedded marketing dashboard directly in a fullscreen modal.
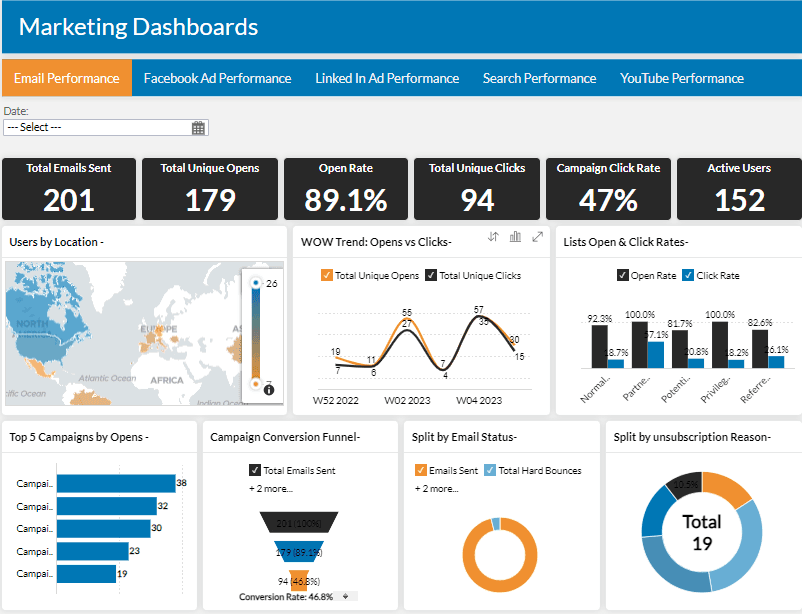
Track email and campaign KPIs such as sends, clicks, opens, rates, and active users in one place.
480K
▲ The number of emails dispatched, indicating the scale of your email campaigns.
126K
▲ The number of clicks on links within your emails, showcasing recipient interest and engagement.
38.4%
▲ Instances where recipients open your email, reflecting initial engagement and interest.
126K
▲ The percentage of unique clicks compared to total email opens, indicating the level of interaction and content relevance.
38.4%
▲ The percentage of unique email opens compared to total emails sent, measuring the effectiveness of subject lines and email timing.
41K
▲ The number of recipients who regularly engage with your emails, providing insights into audience retention and campaign effectiveness.
These are the practical marketing challenges this dashboard helps teams resolve.
Marketing teams often struggle to determine which campaigns are delivering the best results. Dashboards provide a centralized view of key performance indicators (KPIs), offering real-time insights into how campaigns are performing. This allows businesses to quickly assess what’s working and make data-driven decisions to optimize marketing strategies.
Many businesses struggle to measure the return on investment (ROI) of their marketing campaigns. Dashboards provide clear and customizable metrics that track the performance of each campaign, allowing businesses to calculate ROI accurately. This ensures that marketing budgets are being spent wisely and efficiently.
Traditional marketing reports often take days or weeks to compile, delaying decision-making. Dashboards provide real-time data and visual reports, enabling faster and more informed decisions. This speed allows marketing teams to adjust strategies promptly for better outcomes.
Aligning marketing strategies with overall business goals is a common challenge. Dashboards help bridge this gap by showing how marketing efforts align with broader company objectives. By visualizing this relationship, businesses can ensure that marketing efforts contribute directly to their long-term goals.
When marketing data is scattered across different departments, it becomes difficult for teams to collaborate effectively. Marketing performance dashboards promote transparency by providing a single, accessible platform where all team members can monitor and discuss performance in real time. This fosters better collaboration and helps all teams stay on the same page.
With multiple data sources such as social media, email marketing, and web analytics, it can be overwhelming to track performance manually. Marketing performance dashboards solve this problem by integrating all the data into one platform, helping businesses consolidate complex data into easy-to-understand visualizations.
Pointer Sectin
Key marketing dashboard capabilities with context from the source page.
Getting a Let's Viz marketing dashboard is the perfect way to organise this data and display it in a comprehensive yet easy-to-understand manner.
Let's Viz Dashboard is developed with every marketer in mind, and it provides this data in the form of tables, bar charts, and pie charts.
The Let's Viz marketing dashboard displays every parameter such as sales, target, products, sales and product count, top performing chains and candidates and their goals, and much more.
The Let's Viz marketing dashboard is intended to track all of the key performance indicators (KPIs) that are required for success.
How this dashboard helps teams move from scattered channel reporting to fast, data-backed campaign decisions.
Marketing teams often struggle with scattered channel data, delayed reporting, and unclear campaign ROI visibility.
This dashboard centralizes campaign and funnel KPIs in one live view for faster marketing decisions. Want a marketing reporting setup like this? Browse more examples in our Zoho dashboard gallery.
Find answers to common questions about this marketing dashboard.
A Marketing Performance Dashboard is a tool that helps businesses track, analyze, and visualize the performance of their marketing campaigns in real time. It consolidates data from multiple sources into a single, easy-to-read interface, allowing businesses to make data-driven decisions quickly.
From Lets Viz
We connect your tools, model the right KPIs and automate weekly executive reporting—so leadership sees the same truth every week.
NDA-safe · No obligation · Clear next steps