How to Use Power Query to Clean Data Before Modeling in Power BI
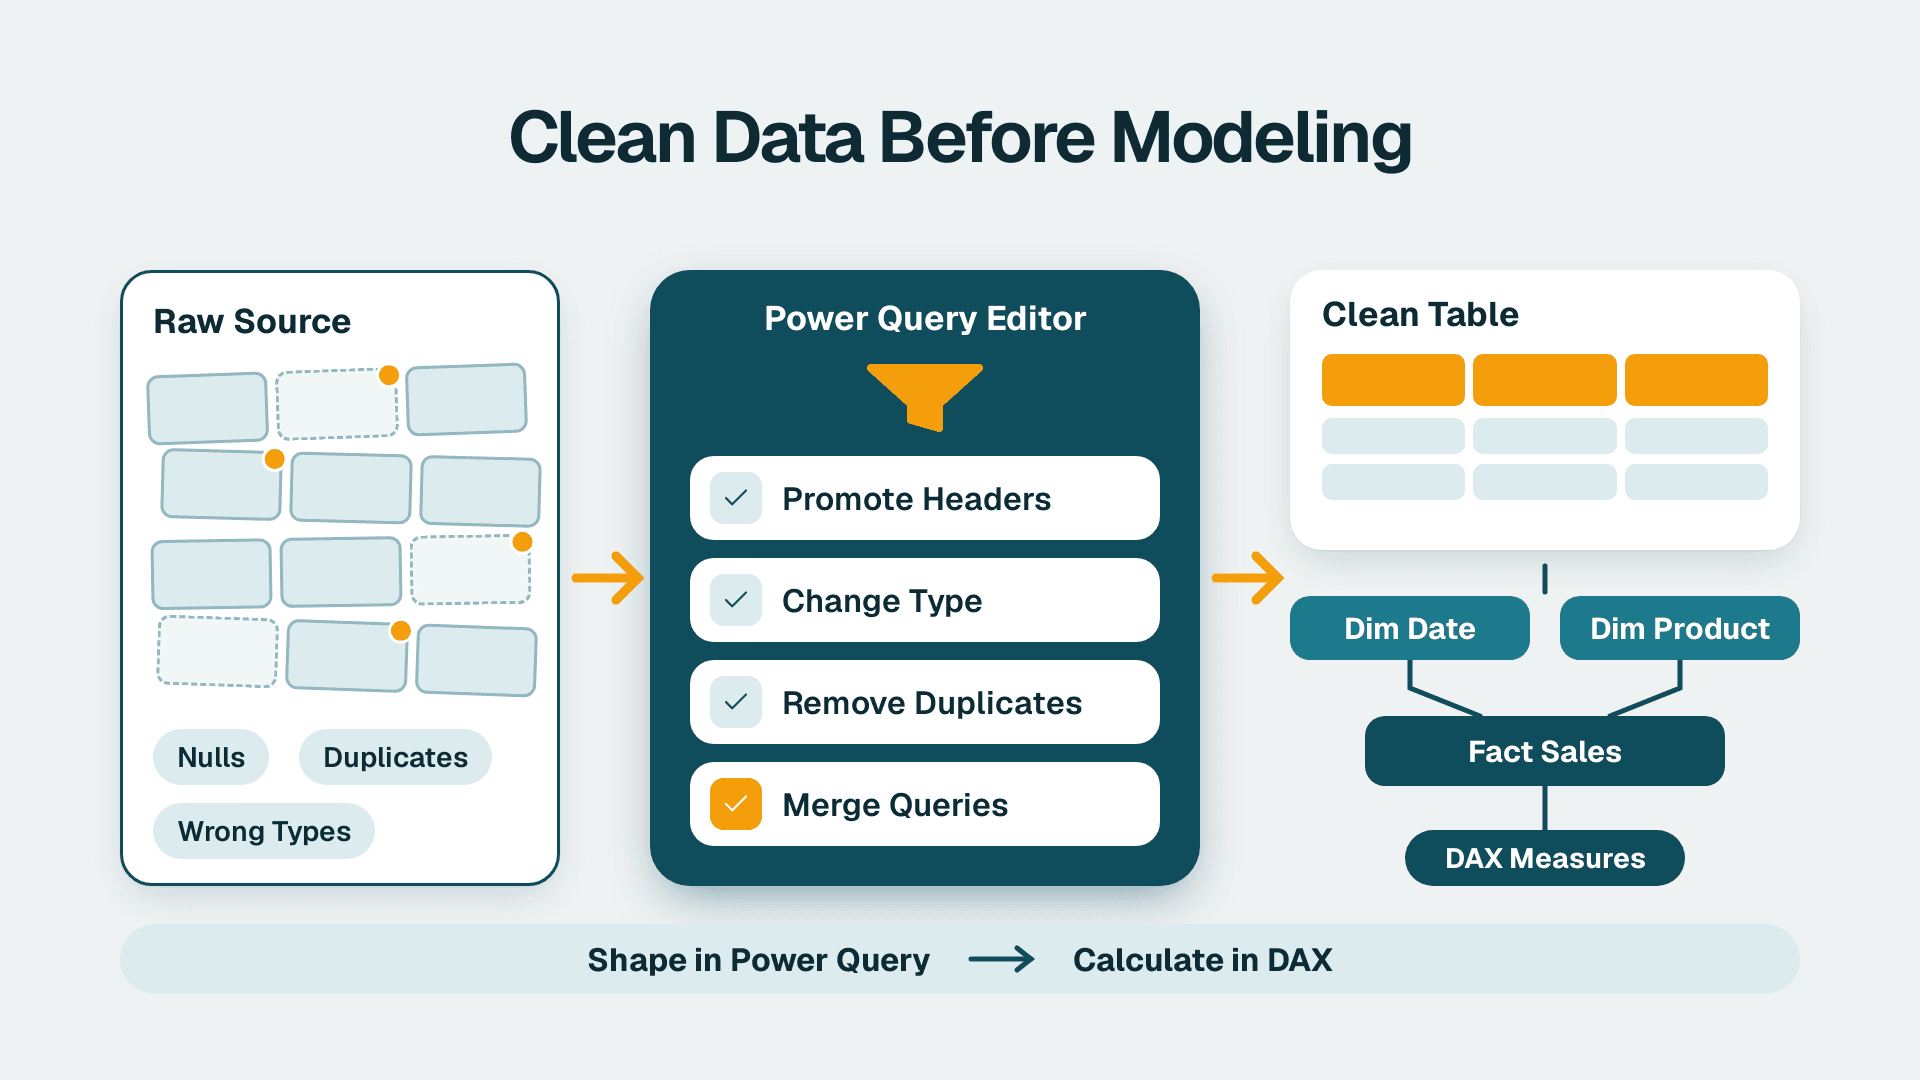
You will clean and reshape a raw source in the Power Query Editor, load it into a Power BI model, and decide which transforms stay in Power Query and which belong in DAX. Plan on about 90 minutes for your first table, and much less for each table after that, because the pattern repeats.
Key Takeaways
- Power Query prepares the data (types, cleanup, reshaping, joins); DAX calculates on the prepared data.
- Anything that changes row-level shape or quality belongs in Power Query, so the model stays small and consistent.
- Anything that must respond to filters, slicers or time periods belongs in a DAX measure.
- Every click in the editor is recorded as a step, so the cleanup is repeatable on each refresh.
- Most report disagreements trace back to a missing or misplaced transform, not to bad DAX.
What You'll Need
Before you start, confirm you have the following. Missing any of these is the usual reason people stall at step 2.
- Power BI Desktop, installed on Windows. It is free to download, and it contains the Power Query Editor.
- Read access to the source: a file path, a database login, or an API credential from whoever owns the system.
- One real source table that currently causes pain, such as a general ledger export, an ERP sales extract or a CRM opportunity list. Do not start with a perfect sample file.
- A Pro or Premium Per User licence only when you are ready to publish and share. Building in Desktop does not require one. If you are still deciding on licences, read Power BI Pro vs PPU vs Fabric: Which Licence You Need.
- A list of 5 to 10 numbers you can verify, such as total revenue for last month, so you can prove the cleaned data is right.
If you would rather have an experienced team set the pattern up once and hand it over, that is the kind of work our Power BI consulting practice does. The steps below work either way.
Here is the quick decision table you will use in Step 6:
| Task | Do it in Power Query | Do it in DAX |
|---|---|---|
| Change a data type | Yes | No |
| Trim spaces, fix casing, replace values | Yes | No |
| Remove columns or filter out rows you never need | Yes | No |
| Unpivot month columns into rows | Yes | No |
| Merge two tables on a key | Yes | Only for small lookups |
| Total, ratio or percentage that changes with filters | No | Yes, as a measure |
| Year to date, prior year, rolling 12 months | No | Yes, as a measure |
| A fixed row-level label such as an age band | Yes | Only if it depends on the model |
Step 1: Learn what Power Query is and open the Power Query Editor
If you are asking what is Power Query, Microsoft describes it as a data transformation and data preparation engine with a graphical interface for getting data from sources and an editor for applying transformations. It does not store data itself. The product that hosts it, such as Power BI, decides where the results land.
The relationship of Power Query and Power BI is simple. Power Query sits in front of the model. It pulls data in and shapes it. The model and DAX then work on whatever Power Query delivers.
To open it:
1. In Power BI Desktop, select the Home tab.
2. Select Transform data, then Transform data again in the dropdown.
3. A new window opens. This is the Power Query Editor.
What you should see: a list of queries on the left, a data preview in the middle, and a Query Settings pane on the right with a section called Applied Steps. If Query Settings is missing, go to the View tab and turn on Query Settings.
That Applied Steps list is the whole idea. When you create a transformation, Power Query writes the M code for it automatically, and it replays those steps in order on every refresh.
Step 2: Connect to the source and shrink it to what you need
Start by pulling the source in and cutting it down. Working with fewer columns and rows makes every later step faster.
1. In the editor, select Home, then New Source, and choose your source (Excel workbook, Text/CSV, SQL Server database or similar).
2. Enter the path or server details and the credentials when prompted.
3. In the Navigator window, tick your table and select Transform Data, not Load. Loading first skips the cleanup.
What you should see: the table in the preview, with one step called Source (and often Navigation) in Applied Steps.
Now trim it:
- Select Home, then Choose Columns, and untick every column no report will use. Free-text notes, internal IDs and audit fields are common candidates.
- Use the filter arrow on a column header to remove rows you never need, such as test accounts, voided entries or years outside your reporting window.
This matters for a practical reason. Power Query lets you work against a subset of the data to define your transformations, so you can filter down to a manageable size before the full load.
What you should see: fewer columns, and new steps named Removed Other Columns and Filtered Rows.
Step 3: Promote headers and set data types
Wrong types cause more silent errors than any other issue. A date held as text will not sort or work with time intelligence, and a number held as text will not sum.
1. If your first row holds the column names, select Home, then Use First Row as Headers.
2. Click the small type icon at the left of each column header and pick the correct type: Whole Number, Decimal Number, Fixed decimal number for currency, Date, or Text.
3. For dates that arrive as text in a different regional format, right-click the column, choose Change Type, then Using Locale, and pick the data type and locale that match the source (for example, English (United Kingdom) for day-first dates).
What you should see: a Changed Type step, and the icons in the headers changing from `ABC123` (any type) to specific icons. Use Fixed decimal number for money so you avoid floating-point rounding. M has 128-bit decimal as well as the IEEE 754 double type, and choosing the right one is what protects your totals.
Step 4: Clean the values
Now fix the values themselves. Do each of these on the columns that need it, and keep each as its own step so you can see what you did later.
1. Trim and clean text. Select the text columns, then go to Transform, Format, and choose Trim, then repeat with Clean. This removes trailing spaces and hidden characters that stop two identical-looking customer names from matching.
2. Standardise casing. Under Transform, Format, choose Capitalize Each Word or UPPERCASE for key fields.
3. Replace values. Right-click a column, choose Replace Values, and map inconsistent entries, for example `N/A` to a blank, or `US` and `USA` to one value.
4. Fill gaps. For exports where a group name appears only on the first row, select the column and choose Transform, Fill, Down.
5. Split combined fields. Select a column such as `Account - Description`, then Home, Split Column, By Delimiter.
6. Remove duplicates. Select the key column or columns, right-click, and choose Remove Duplicates. Check first that the key really is unique.
7. Handle errors. Select a column with error cells, then Home, Remove Rows, Remove Errors, or use Replace Errors if you need to keep the row.
What you should see: each action adds a named step. Click a step to view the data as it looked at that point, which is the fastest way to find which action broke something.
If you want to see the M behind a step, select the View tab, then Advanced Editor. A step such as filtering blanks reads like `= Table.SelectRows(Source, each [Amount] <> null)`. You do not need to write M to do this work, but reading it helps. Note that M is case-sensitive, so `Amount` and `amount` are different names.
Step 5: Reshape the table, then join and stack sources
Reshaping is where Power Query earns its keep, because DAX cannot easily change the grain of a table.
Unpivot wide data
Spreadsheet-style exports often have one column per month. A model wants one row per month.
1. Select the identifying columns (for example `Account` and `Department`).
2. Go to Transform, then Unpivot Columns, then Unpivot Other Columns.
3. Rename the two new columns from `Attribute` and `Value` to `Month` and `Amount`.
What you should see: twelve month columns collapse into two columns, and the row count multiplies by about twelve. Choosing Unpivot Other Columns rather than selecting the month columns means next year's new month columns are picked up automatically.
Merge to bring in descriptive columns
1. Select Home, then Merge Queries.
2. Pick the second table, click the matching key column in each table, and choose a Join Kind (usually Left Outer).
3. Expand the new column using the arrows in its header and tick only the fields you need.
This is the Power Query equivalent of a lookup. For a few hundred rows in the model itself, a DAX lookup can be fine, and we cover that in DAX LOOKUPVALUE explained with examples. For large tables, merge in Power Query.
Append to stack files
When you have one file per month or region with the same columns, select Home, Append Queries, and choose the tables. The result is one tall table. If the sources are files in a folder, use Get Data, then Folder, so new files join automatically.
Step 6: Decide what belongs in Power Query and what belongs in DAX
Use this rule: if the result is the same no matter what a user filters, build it in Power Query. If the result depends on what a user selects, build it in DAX as a measure.
This is also the practical answer to when to use calculated columns vs measures in DAX:
- A calculated column is stored row by row in the model and recalculated on refresh. It suits a fixed row-level value, but you can often do the same thing in Power Query, which keeps the model lighter and the logic in one place.
- A measure is calculated at query time, in the context of the filters in the report. Use it for totals, margins, ratios, year to date and anything a slicer should change.
A concrete case: line revenue as `Quantity * Unit Price` can be added in Power Query with Add Column, Custom Column. A gross margin percentage must be a measure, because a percentage of totals is not the sum of row percentages. The pattern in DAX is a division of two sums, for example `DIVIDE(SUM(Sales[Margin]), SUM(Sales[Revenue]))`.
By contrast, do not build these in DAX when Power Query can do them: data type fixes, text cleanup, splitting fields, unpivoting, and filtering out junk rows. DAX will either not do them or do them slowly. If a measure you wrote later feels slow, DAX Studio can help find and fix slow measures.
Keep folding where you can
For database sources, Power Query can translate steps into a query the database runs, which is called query folding. To check, right-click a step in Applied Steps. If View Native Query is available, the step is folding. If it is greyed out, the step runs on your machine. Put folding-friendly steps (filters, column removal) first and heavy custom steps later. Hosts differ in connector support, and Microsoft notes that a connector might be available in one host but not another, so test your source in the product you will actually use.
One limit to know
Power Query is a one-way pipe from source to model. It does not write changes back. If your plan includes Power BI write-back to database options, that is a separate design decision made in the report layer, and it should not be improvised inside your cleanup queries.
Step 7: Name your steps, load, and verify the numbers
1. Rename key steps. Right-click a step, choose Rename, and use plain names like `Removed void entries`. Whoever inherits this will thank you.
2. Rename each query in the left pane to a clear table name such as `Sales` or `Chart of Accounts`.
3. For lookup tables you only use for merging, right-click the query and untick Enable Load so they do not clutter the model.
4. Select Home, then Close & Apply.
What you should see: the editor closes, a loading dialog appears, and your tables show in the Fields pane in the main window.
Now verify. Build a simple table visual with your known number, such as last month's revenue, and compare it to the source system. If it differs, step through Applied Steps in the editor and check the row count after each filter or join. For finance data, this 7-step reconciliation walks the rest of the checks.
To keep it current, queries can be refreshed manually or on a schedule in Power BI once published. Finally, browse our dashboard examples if you want ideas for what to build on top of the clean tables, including finance views.
Common Mistakes
- Loading before cleaning. Selecting Load in the Navigator skips every step above. Fix: always choose Transform Data, and reopen the editor from Home, Transform data if you already loaded.
- Leaving numbers or dates as text. Totals show as zero or dates sort alphabetically. Fix: set types in Step 3 and use Using Locale for foreign date formats.
- Unpivoting by selecting month columns. Next period's new column is missed. Fix: select the identifier columns and use Unpivot Other Columns.
- Building percentages as columns. Ratios come out wrong at subtotal level. Fix: sum the numerator and denominator in a measure.
- Removing duplicates on the wrong key. Valid rows vanish silently. Fix: check the row count before and after, and test uniqueness on the true key.
Troubleshooting
- Refresh fails with a credentials or privacy error. The data source credentials are missing or the privacy levels conflict when two sources are combined. Re-enter credentials under Home, Data source settings, and review privacy levels there.
- A step shows an error after the source changed. A column was renamed or removed upstream, so a later step refers to a name that no longer exists. Click the failing step, update the column name, or fix it at the source.
- A Run Native Query prompt keeps appearing. A step is sending a hand-written database query that Power BI asks you to approve. The Fabric community discussion covers how to open the query in the editor and approve it.
If you want a second pair of eyes on a model that already exists, or a tested pattern for your finance and operations sources, talk to our Power BI consulting team about a short engagement.
Sources
- Power Query documentation: what is Power Query (Microsoft Learn)
- Power Query (Wikipedia)
- Disable Run Native Query Dialog (Fabric Community)
Facts and prices checked October 2026.
---
About Lets Viz: Lets Viz is a data analytics consultancy that has built Power BI models, dashboards and managed reporting since 2020. We serve mid-market teams in healthcare, financial services, distribution and professional services, and we hold a 5.0 rating on Clutch.