Revenue
$2.4M
▲ Total income generated from sales, indicating overall business performance and market demand.
Achieve revenue growth with our proactive Power BI Sales Dashboard. Visualize sales trends, analyze customer demographics, and identify cross-selling opportunities. Harness actionable insights to prioritize leads, nurture prospects, and close deals effectively. Maximize your sales effectiveness with our strategic Power BI Sales Dashboard. Monitor sales KPIs, assess team performance, and track sales targets in real-time. Gain insights to refine strategies, allocate resources efficiently, and drive sustainable sales growth
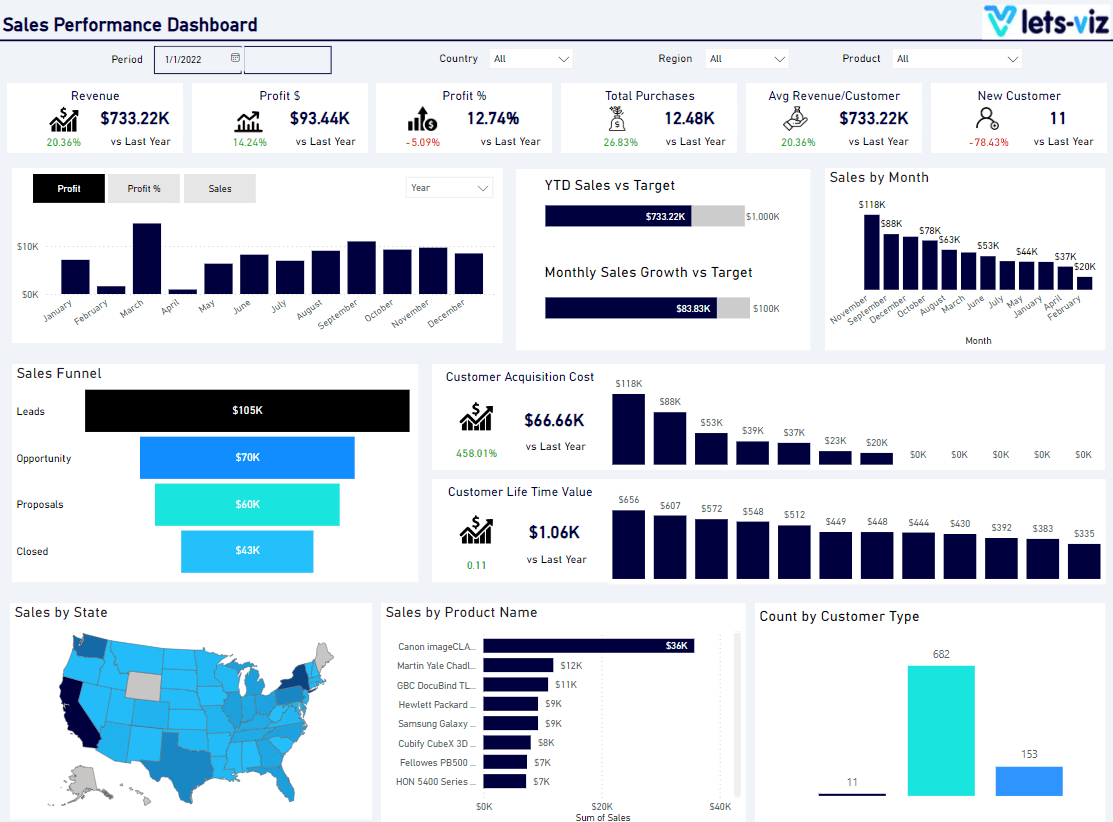
Track revenue, purchase volume, profit, new customers, profit percentage, and customer value in one Power BI sales view.
Built in Power BI with live sales KPI tracking and profitability drill-down analysis.
Trusted by teams across 15+ countries
Explore the core Power BI sales dashboard views built for revenue and profitability decisions.
Interactive Power BI sales reporting view.
Open the live embedded Power BI sales dashboard directly in a fullscreen modal.
Track revenue, purchase volume, profit, new customers, profit percentage, and average revenue per customer in one place.
$2.4M
▲ Total income generated from sales, indicating overall business performance and market demand.
18%
▲ Total number of transactions completed, indicating sales volume and customer activity.
18%
▲ Total earnings after deducting all expenses, reflecting the financial success and sustainability of sales activities.
24%
▲ Number of new customers acquired, reflecting growth and effectiveness of sales strategies in expanding the customer base.
18%
▲ Percentage of profit relative to revenue, measuring profitability and cost efficiency in sales operations.
$2.4M
▲ Average income generated from each customer, providing insights into customer value and spending behavior.
These are the practical sales challenges this dashboard helps teams resolve.
Sales Dashboard integrates key metrics such as Sales Volume , Profit , and Profit Ratio , giving businesses a clear view of sales effectiveness. Teams can identify if increased sales are translating to increased profits or if sales volume is being driven by low-margin products.
Sales Dashboard helps segment customers based on shipping costs and product quantity, making it easier to identify customer segments where shipping costs are particularly high or profits are lower, enabling businesses to adjust strategies accordingly.
Sales dashboards provide a unified view of sales data, ensuring consistent insights across the entire team, eliminating discrepancies that can hinder decision-making.
Sales Dashboard , advanced data visualization tools help identify patterns in sales trends, allowing businesses to quickly adapt their strategies based on insights.
It enables users to customize dashboards to meet specific needs, ensuring that sales data is presented in the most meaningful and actionable way possible.
Sales Dashboard provides real-time insights into sales, profit, and profit ratios, enabling businesses to track profitability over time. This helps identify whether profit margins are increasing or decreasing and what actions need to be taken.
Key Details
Key sales dashboard capabilities with context from the source page.
A sales dashboard represents sales data in one analytical layout so teams can monitor key indicators from a single page.
You can track sales, profit, profit ratio, quantity, and shipping costs in one place to understand business performance clearly.
Sales distribution and KPI trends can be monitored over time, helping teams evaluate what is working and where action is needed.
Clear visual summaries help organizations simplify reporting and optimize sales strategy based on actionable insights.
How this dashboard helps sales teams move from fragmented reporting to faster, profit-aware decisions.
Sales teams often struggle with fragmented performance signals, inconsistent reporting, and low visibility into profitability and customer value.
This dashboard centralizes revenue, purchase, profit, customer growth, and profitability KPIs in one Power BI sales view for faster commercial decisions. Want a sales dashboard like this for your team? See our Managed Power BI service.
Find answers to common questions about this sales dashboard.
The Sales Dashboard is designed to provide businesses with real-time insights into key sales metrics, including sales, profit, profit ratio, quantity sold, and shipping costs. It helps you make data-driven decisions to optimize performance and profitability.
From Lets Viz
Experience superior data analysis with our custom dashboards. Specializing in all tools and technologies, we turn data into visually compelling, actionable insights
NDA-safe · No obligation · Clear next steps