Throughput
182K units
▲ Units, orders or jobs completed per week, by site, line or team.
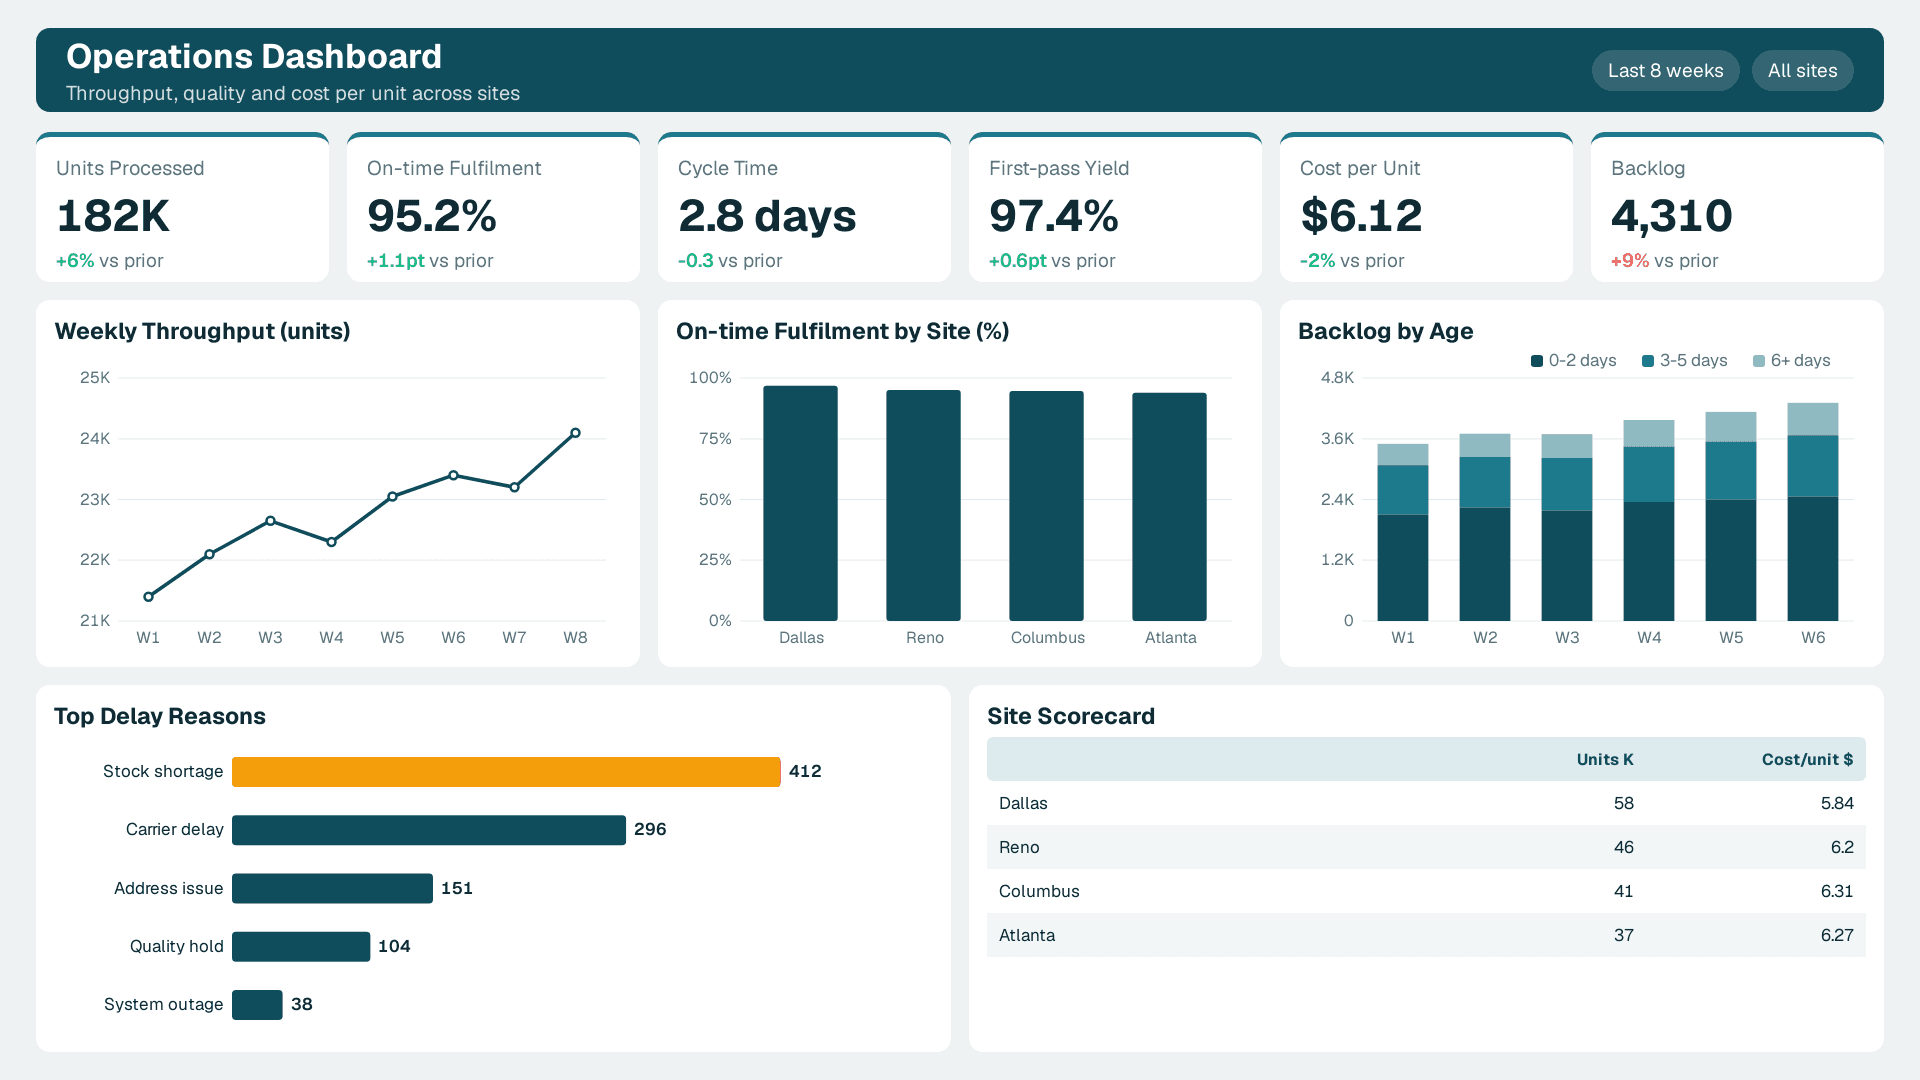
Throughput, on-time delivery, SLA, backlog and cost per unit in one view, refreshed from your ERP, WMS and service tools.
Built in Power BI on data from ERP, WMS, MES, ServiceNow, field service and spreadsheets.
Trusted by teams across 15+ countries
A site operations view for throughput and cost, and a service operations view for SLA and workload.
Throughput, on-time fulfilment, cycle time, first-pass yield, cost per unit and backlog by site.
Pick the ones that show flow, quality and cost; each needs one definition across sites and teams.
182K units
▲ Units, orders or jobs completed per week, by site, line or team.
95.2%
▲ Orders or jobs completed by the promised date.
2.8 days
▲ Average time from order or request received to completion.
97.4%
▲ Share of work done right the first time, without rework.
$6.12
▲ Operating cost divided by units processed, by site.
4,310
▲ Open work waiting to be processed, split by age.
The operational reporting problems we are asked to solve most often.
Backlog by age and on-time rate flag slowdowns the same day.
One definition of throughput, cost and on-time across every site.
Delay reasons are categorised and ranked, so fixes target the biggest cause.
Workload against capacity shows where overtime or hiring is needed.
Reports refresh from ERP, WMS and service tools on a schedule.
Operating cost joins volume data so cost per unit is visible by site.
Each operations dashboard follows your sites, processes, SLAs and shift patterns.
What Can Be Customized
KPI definitions and SLA targets
Data sources (ERP, WMS, MES, ServiceNow, field service)
Refresh frequency, down to hourly
Views for operations leaders, site managers and team leads
Common questions about operations dashboards.
An operations dashboard is one view of how work flows through the business: throughput, on-time delivery, quality, backlog and cost, refreshed often enough that managers can act within the week or the shift.
From Lets Viz
We connect your operational systems, agree KPI and SLA definitions, and ship a first version in one to two weeks.
NDA-safe · No obligation · Clear next steps