Total Patients
18.6K
▲ Total number of patients treated, indicating the hospital’s capacity and service utilization.
Drive excellence in healthcare with our Customise Power BI Hospital Performance Dashboard. Monitor critical metrics, enhance resource management, and improve patient outcomes. Gain actionable insights to optimize hospital operations and deliver superior care.
Track total patients, doctors, treatment cost, departmental demand, operational cost, and patient satisfaction in one Power BI hospital view.
Built in Power BI for healthcare teams with live capacity, cost, and care-quality KPI tracking.
Trusted by teams across 15+ countries
Explore the core Power BI hospital dashboard views built for healthcare operations and resource management decisions.
Interactive Power BI hospital performance reporting view.
Open the live embedded Power BI hospital performance dashboard directly in a fullscreen modal.
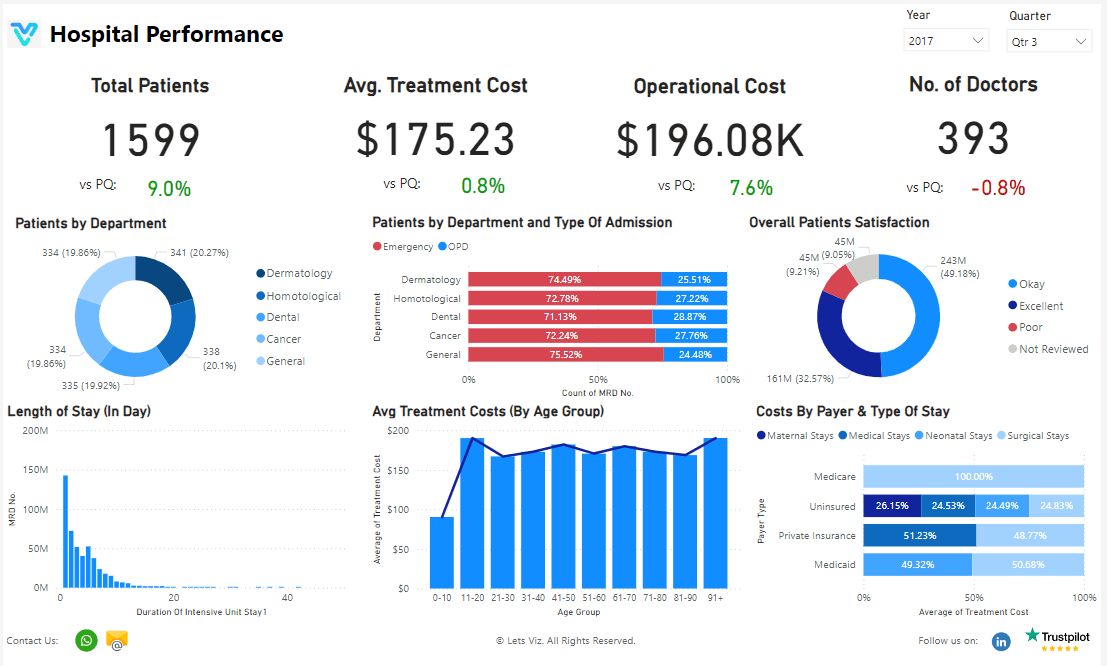
Track total patients, number of doctors, average treatment cost, departmental demand, operational cost, and patient satisfaction in one place.
18.6K
▲ Total number of patients treated, indicating the hospital’s capacity and service utilization.
214
▲ Total number of doctors employed, indicating medical staff capacity and availability.
$1.2M
▲ Average cost per treatment, measuring the financial efficiency and affordability of healthcare services.
18.6K
▲ Number of patients treated in each department, providing insights into departmental demand and resource allocation.
$1.2M
▲ Total expenses incurred in running the hospital, reflecting budget management and operational efficiency.
92%
▲ Average satisfaction rating from patient feedback, indicating the quality of care and patient experience.
These are the practical hospital performance challenges this dashboard helps teams resolve.
Without a centralized hospital dashboard, teams struggle to understand patient load across the organization and respond quickly to changing service demand.
Tracking doctor availability and treatment demand in separate reports makes it harder to align staffing decisions with real hospital needs.
When treatment cost and operational cost are scattered across systems, leadership has limited visibility into financial efficiency and affordability.
Without patient-by-department reporting, it becomes difficult to identify which service lines need more resources or operational support.
Delayed reporting slows down hospital decisions related to resource allocation, service optimization, and care delivery improvements.
Patient satisfaction data is more valuable when combined with operational KPIs in one view, helping teams improve care quality with better context.
Key Details
Key hospital dashboard capabilities with context from the source page.
Track patient volume, doctor capacity, and departmental load in one Power BI dashboard to support faster operational decisions.
Treatment cost and operational cost metrics help teams measure financial efficiency while maintaining service quality.
Patients by department reporting helps hospitals allocate staff and resources where demand is increasing.
Patient satisfaction can be reviewed with capacity and cost KPIs to improve both care quality and operational performance.
How this dashboard helps hospital teams move from fragmented reporting to faster, better-informed operational and care decisions.
Hospital teams often struggle with fragmented operational metrics, delayed visibility into patient demand, and limited clarity on cost and care-quality trends.
This dashboard centralizes patient volume, staffing, cost, department demand, and satisfaction KPIs in one Power BI hospital view for faster operational decisions. Want a healthcare KPI dashboard like this? See our Managed Power BI service.
Find answers to common questions about this hospital performance dashboard.
It centralizes hospital performance metrics into one reporting view so teams can monitor care delivery, staffing, cost, and patient experience more effectively.
From Lets Viz
Experience superior data analysis with our custom dashboards. Specializing in all tools and technologies, we turn data into visually compelling, actionable insights
NDA-safe · No obligation · Clear next steps