Ending Cash Balance
$2.4M
▲ Total cash available at the end of a period, indicating liquidity and the ability to meet short-term obligations.
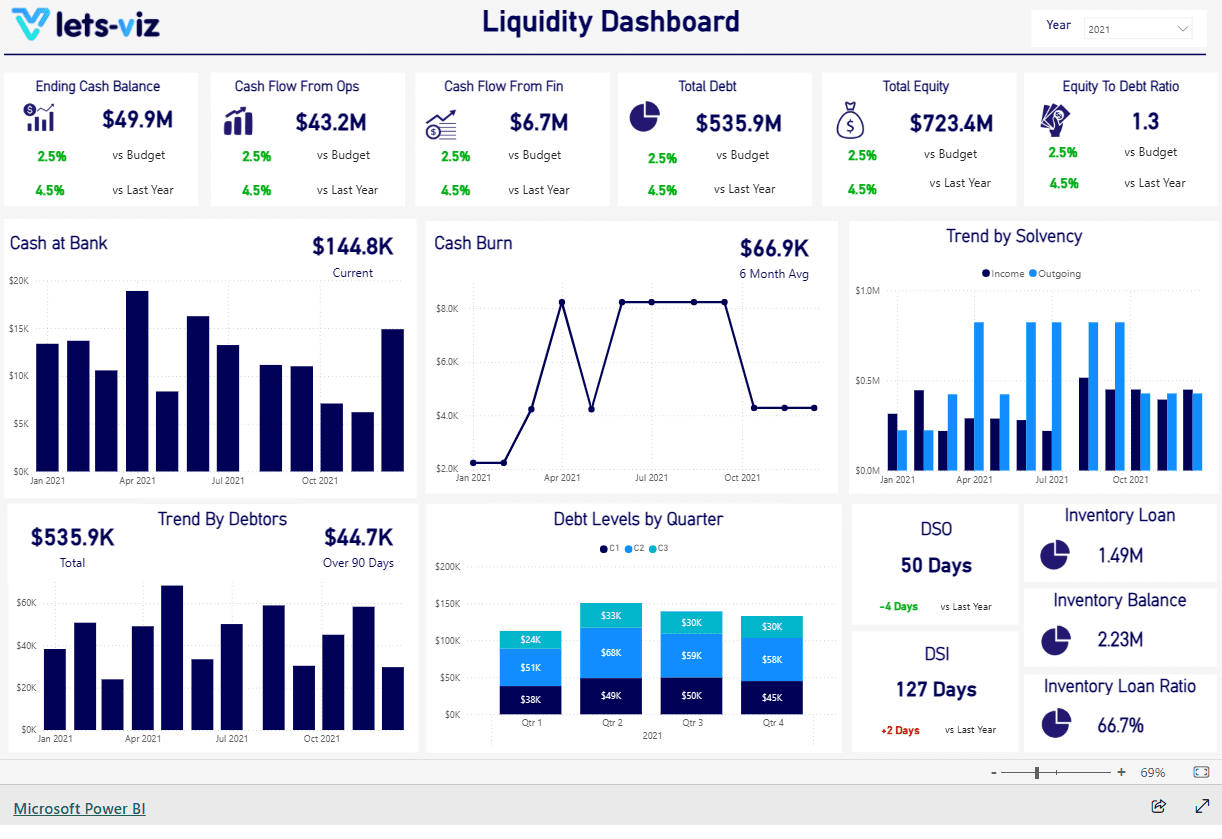
Gain a competitive edge with our Power BI Liquidity Finance Dashboard. Track ending cash balance, visualize cash flow patterns, manage total debt, and optimize equity-to-debt ratio. Harness actionable insights to maintain liquidity and drive business growth in dynamic markets.
Track liquidity coverage, working capital movement, cash position, receivables/payables aging, and short-term obligations in one Power BI finance view.
Built in Power BI with liquidity-focused KPI tracking for working capital, cash position, and short-term risk analysis.
Trusted by teams across 15+ countries
Explore the core Power BI finance liquidity dashboard views designed for faster treasury and finance decisions.
Interactive Power BI finance liquidity reporting view.
Open the live embedded Power BI finance liquidity dashboard directly in a fullscreen modal.
Track liquidity ratio, working capital, receivables, payables, cash runway, and short-term risk indicators in one place.
$2.4M
▲ Total cash available at the end of a period, indicating liquidity and the ability to meet short-term obligations.
18%
▲ Aggregate amount of all outstanding debts, showing the company’s leverage and financial obligations.
$740K
▲ Net cash generated from operating activities, reflecting the core business profitability and operational efficiency.
24%
▲ Total value of shareholder equity, indicating the net worth and financial strength of the company.
99.2%
▲ Net cash flow from financing activities, indicating the impact of debt, equity transactions, and dividends on liquidity.
2.1x
▲ Ratio of total equity to total debt, measuring financial leverage and stability, and assessing the risk level of the company’s capital structure.
These are the practical liquidity reporting challenges this dashboard helps teams resolve.
Track your business’s ending cash balance in real-time, ensuring you’re always informed about available liquidity for decision-making.
Gain clear visibility into cash inflows and outflows, helping you identify patterns and avoid cash shortages.
Analyze cash flow from operations to ensure that day-to-day activities are generating sufficient cash to sustain business operations.
Make more informed decisions with actionable insights into your liquidity, empowering your business to thrive in fluctuating markets.
Monitor and optimize your working capital to ensure the smooth functioning of operations and minimize unnecessary financial strain.
Leverage intuitive and interactive visuals that turn complex financial data into clear, actionable insights for all stakeholders.
Key Details
All major liquidity dashboard points summarized as concise bullets.
A visualised financial dashboard can help individuals and organisations track their financial performance over time. By visualising financial data in real-time, users can quickly see how their finances are changing and identify areas where they may need to make adjustments.
A financial dashboard can also be used for budgeting and forecasting purposes. By tracking expenses, revenues, and other financial metrics, users can create accurate budgets and forecasts for the future.
A visualised financial dashboard can help users identify trends and patterns in their financial data. By visualising data in different ways, users can spot trends that may not be apparent in raw data or traditional financial reports.
A visualised financial dashboard can also be used for financial reporting purposes. By presenting financial data in an easy-to-understand format, users can create reports that are accessible to a wider audience.
A visualised financial dashboard helps users make better financial decisions and take more calculated risks with money. With simple-to-understand dashboards, users can quickly analyze their financial situation and make more calculated decisions about investments and expenses.
How this dashboard helps finance and treasury teams move from fragmented liquidity reporting to faster cash and working-capital decisions.
Finance and treasury teams often struggle with fragmented liquidity reporting, delayed visibility into short-term cash risk, and low confidence in working-capital decisions.
This dashboard centralizes liquidity coverage, working capital movement, receivables/payables trends, and short-term cash risk indicators in one Power BI view for faster finance decisions. Want a finance dashboard like this for your team? See our Power BI for SaaS Finance service.
Find answers to common questions about this finance liquidity dashboard.
A Financial Liquidity Dashboard is a tool that visualizes key financial metrics such as cash balance, cash flow, debt levels, and equity, helping businesses manage and optimize their liquidity.
From Lets Viz
Experience superior data analysis with our custom dashboards. Specializing in all tools and technologies, we turn data into visually compelling, actionable insights
NDA-safe · No obligation · Clear next steps