Total Amount
$2.4M
▲ Total revenue generated from all sales, indicating overall business performance and market demand.
Transform your Shopify store with our comprehensive dashboard. Track key metrics, analyze trends, and optimize performance. Enhance customer experience and maximize profits with real-time data insights.
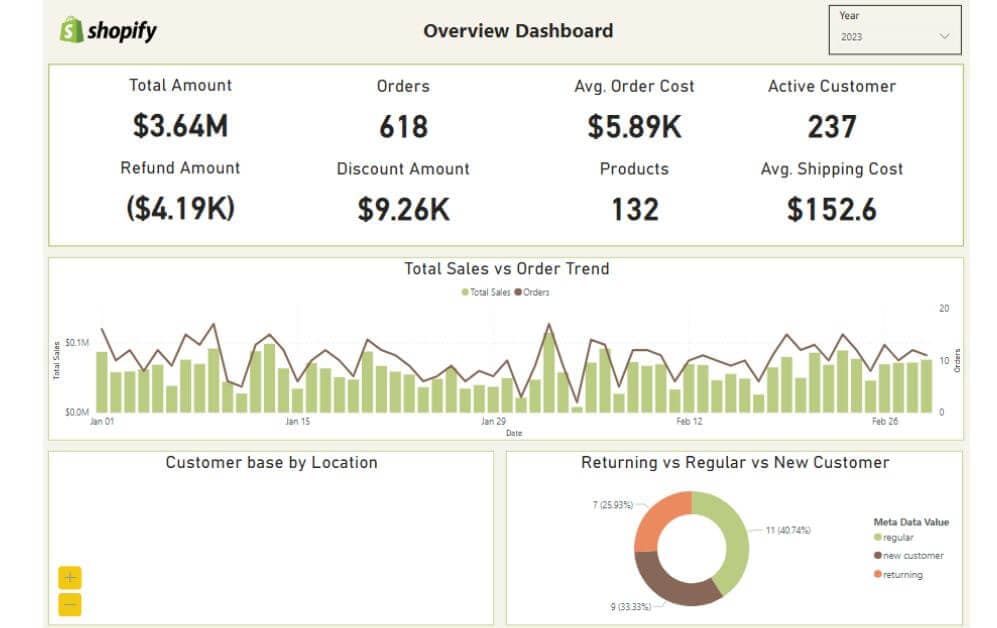
Track revenue, orders, conversion rate, AOV, top products, and channel performance in one Power BI Shopify view.
Built in Power BI for Shopify teams with unified revenue, conversion, and product performance visibility.
Trusted by teams across 15+ countries
Explore the core Power BI Shopify dashboard views built for ecommerce performance decisions.
Interactive Power BI Shopify reporting view.
Open the live embedded Power BI Shopify dashboard directly in a fullscreen modal.
Track revenue, orders, conversion rate, average order value, top products, and channel performance in one decision-ready view.
$2.4M
▲ Total revenue generated from all sales, indicating overall business performance and market demand.
18%
▲ Total value of refunded transactions, providing insights into return rates and customer satisfaction.
$740K
▲ Total number of orders placed, reflecting sales volume and customer purchase activity.
24%
▲ Total value of discounts applied, indicating promotional effectiveness and impact on revenue.
$1.2M
▲ Average revenue per order, measuring customer spending behavior and order value.
2.1x
▲ Total number of distinct products sold, reflecting product variety and inventory management.
12.8K
▲ Number of customers who have made purchases within a specific period, indicating customer retention and engagement.
$1.2M
▲ Average cost incurred for shipping per order, indicating logistical efficiency and cost management.
These are the ecommerce reporting challenges this dashboard helps teams resolve.
When revenue, orders, and conversion data live in separate reports, teams struggle to understand overall Shopify performance quickly.
Without a centralized Shopify dashboard, it is harder to spot sudden changes in sales trends or conversion rate.
Teams need a unified view of top products and channel performance to optimize merchandising and marketing spend.
Customer trends and retention signals are easier to act on when they are tracked alongside revenue and order metrics.
Ecommerce teams lose time exporting Shopify data into spreadsheets instead of acting on live insights.
A single Power BI view standardizes KPIs so leadership, marketing, and ops can align on the same metrics.
Key Details
Key Shopify dashboard capabilities with context from the source page.
Track revenue, orders, and conversion KPIs in one Power BI view to speed up ecommerce decisions.
Identify top products and underperforming items faster with a consolidated Shopify dashboard.
Compare channel-level sales and conversion performance without switching tools.
Follow conversion rate and AOV trends over time to catch performance changes early.
How this dashboard helps ecommerce teams move from fragmented Shopify reporting to faster performance decisions.
Ecommerce teams often struggle with fragmented Shopify reporting, delayed revenue visibility, and low confidence in conversion and product performance trends.
This dashboard centralizes Shopify revenue, orders, conversion rate, average order value, and product performance KPIs in one Power BI view for faster ecommerce decisions. Want a Shopify reporting setup like this? See our marketing dashboard & reporting automation service.
Find answers to common questions about this Shopify dashboard.
It consolidates Shopify performance data into one Power BI view so teams can monitor revenue, orders, and conversion trends in one place.
From Lets Viz
Experience superior data analysis with our custom dashboards. Specializing in all tools and technologies, we turn data into visually compelling, actionable insights
NDA-safe · No obligation · Clear next steps