Impression
2.8M
▲ Total number of times your social media content is displayed, indicating overall visibility and reach.
Unleash the power of the Combined Social Media Dashboard! Track and optimize performance across Facebook, Twitter, YouTube, and Instagram—all in one place. Boost engagement, analyze metrics, and drive growth with this powerful, unified tool. Elevate your social media game today!
Track reach, engagement, clicks, followers, and video performance across Twitter, Facebook, Instagram, YouTube, and LinkedIn in one Power BI view.
Built in Power BI for cross-platform social teams with unified reach, engagement, and audience visibility.
Trusted by teams across 15+ countries
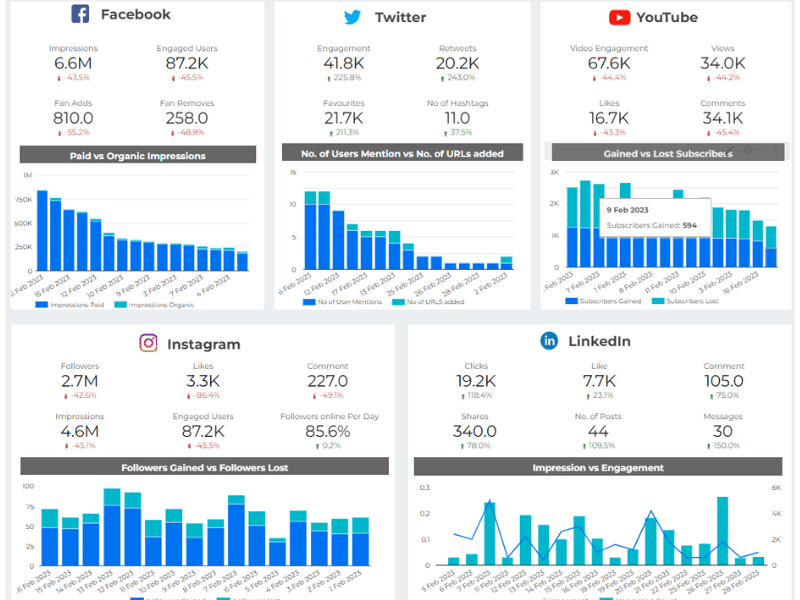
Explore the core Power BI combined social media dashboard views built for cross-platform social reporting decisions.
Interactive Power BI combined social reporting view.
Open the live embedded Power BI combined social media dashboard directly in a fullscreen modal.
Track reach, engagement, clicks, followers, impressions, and video views across platforms in one decision-ready view.
2.8M
▲ Total number of times your social media content is displayed, indicating overall visibility and reach.
18%
▲ Total posts published within a specific timeframe, indicating content activity and frequency.
41K
▲ Number of unique users who interact with your content, reflecting audience engagement and interest.
24%
▲ Number of user comments on your posts, indicating active participation and feedback.
99.2%
▲ Total number of times ads are displayed, indicating the reach and visibility of your campaigns.
126K
▲ Total clicks on links within your posts, reflecting the effectiveness of your content in driving traffic.
38.7K
▲ Instances where users like your content, showcasing positive engagement and content appeal.
9.6%
▲ Total interactions (likes, comments, shares, views) on your video content, measuring video content success and user interest.
These are the cross-platform social reporting challenges this dashboard helps teams resolve.
A combined social media dashboard consolidates all your social media accounts into one platform, saving you time by allowing you to manage multiple profiles without switching between different apps.
With combined dashboards, multiple team members can access and work on social media campaigns simultaneously. This leads to better collaboration and faster content creation.
Social media trends are constantly changing. Combined dashboards allow you to easily monitor trending topics across all platforms and incorporate them into your strategy for better reach and engagement.
By using combined dashboards, businesses can easily track performance and adjust strategies in real-time. This helps ensure a better return on investment (ROI) from social media efforts.
Managing posts from multiple platforms in one place allows you to track your posting schedule more effectively, avoiding overposting or spamming the same content across all channels.
By managing everything in one place, a combined dashboard minimizes the need for multiple logins and platform hopping, saving precious time and effort, especially for businesses and social media managers.
Key Details
Key combined social media dashboard capabilities with context from the source page.
Track performance from Twitter, Facebook, Instagram, YouTube, and LinkedIn in one Power BI view for faster reporting.
A combined dashboard makes it easier to compare reach, engagement, and clicks across platforms in one place.
Follow follower growth and audience interest across channels without jumping between platform reports.
See paid and organic social performance together to optimize content strategy and budget allocation.
How this dashboard helps teams move from fragmented platform reporting to unified social performance decisions.
Marketing teams often struggle with fragmented social reporting, delayed cross-platform visibility, and low confidence in combined engagement and reach insights.
This dashboard centralizes cross-platform social media reach, engagement, clicks, followers, and video KPIs in one Power BI view for faster social decisions. Want a marketing reporting setup like this? Explore our marketing dashboard & reporting automation service.
Find answers to common questions about this combined social media dashboard.
A combined social media dashboard is a Dashboard that allows you to manage multiple social media data from different platforms in one central location.m l.k,
From Lets Viz
Experience superior data analysis with our custom dashboards. Specializing in all tools and technologies, we turn data into visually compelling, actionable insights
NDA-safe · No obligation · Clear next steps