Sales
$2.4M
▲ Total revenue generated from products or services, indicating demand and business growth.
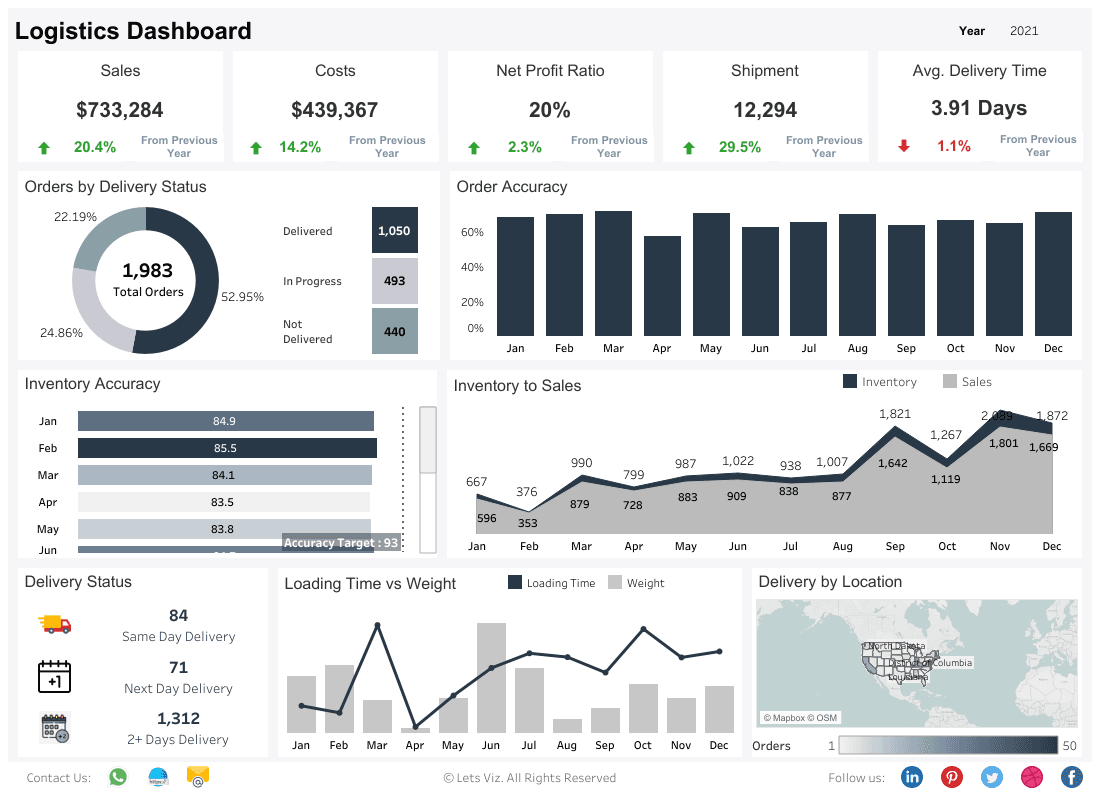
Track key logistics metrics with the Logistics Dashboard. Get real-time insights on sales, costs, net profit ratio, shipment performance, average delivery time, order accuracy, and inventory accuracy to enhance operational efficiency and decision-making
Track key logistics metrics like shipments, delivery time, cost, and inventory performance in one live operational view.
Built for logistics teams with real-time KPI tracking and operational drill-down analysis.
Trusted by teams across 15+ countries
Explore the core logistics dashboard views built for operations and supply-chain decision-making.
Interactive logistics reporting view.
Open the live embedded finance dashboard directly in a fullscreen modal.
Track sales, shipment performance, delivery speed, cost, and inventory movement in one place.
$2.4M
▲ Total revenue generated from products or services, indicating demand and business growth.
18%
▲ Total number of orders shipped, reflecting operational capacity and customer fulfillment success.
$740K
▲ Total expenses incurred in the logistics process, including transportation, storage, and handling, impacting profitability.
24%
▲ Average time taken to deliver orders, indicating efficiency and customer satisfaction in the delivery process.
18%
▲ Percentage of net profit relative to sales, measuring overall financial health and cost efficiency.
2.1x
▲ Graphical representation of inventory levels compared to sales over time, helping optimize stock management and reduce holding costs.
These are the practical logistics challenges this dashboard helps teams resolve.
Without a single KPI view, teams cannot quickly identify weak links across procurement, transport, and storage.
Logistics businesses need a unified system where every operational metric is consistently measured and reviewed.
When one part of the supply chain underperforms, teams need immediate KPI visibility to find root causes faster.
A simplified KPI display is necessary to spot logistics issues early and prioritize corrective actions.
Pointer Section
Key logistics dashboard capabilities with context from the source page.
The Logistics Dashboard helps measure KPIs across shipping and supply-chain steps in one place.
Track sales, costs, net profit ratio, shipments, average delivery times, order status, and inventory metrics.
The dashboard supports deeper analysis by allowing users to click into specific metrics and views.
With operational visibility and faster KPI interpretation, teams can optimize supply-chain performance.
How this dashboard helps operations teams improve supply-chain execution with centralized KPI visibility.
Logistics teams often struggle with fragmented operational signals and delayed issue detection across the supply chain.
This dashboard centralizes logistics KPIs in one live view for faster supply-chain decision-making. Need a logistics dashboard like this for your operations? Browse more examples in our Tableau dashboard gallery.
Find answers to common questions about this logistics dashboard.
The Logistics Dashboard is a comprehensive tool that tracks key performance metrics in logistics such as sales, costs, shipment status, order accuracy, and inventory accuracy, providing insights to optimize your operations.
From Lets Viz
Experience superior data analysis with our custom dashboards. Specializing in all tools and technologies, we turn data into visually compelling, actionable insights
NDA-safe · No obligation · Clear next steps