Total Amount
$2.4M
▲ The total revenue generated from all sales within a specific period. Tracking this KPI helps assess overall store performance and revenue growth, driving data-backed business decisions.
Struggling to keep track of your Shopify store’s performance across various platforms? Feeling overwhelmed by scattered data and unsure where to focus your optimization efforts? You’re not alone. Many Shopify store owners face the challenge of managing diverse data points, hindering their ability to make informed decisions.
This is where a comprehensive Shopify performance dashboard comes in. Imagine having a central hub that tracks key metrics like sales, orders, conversion rates, traffic sources, and customer behavior (#ShopifyAnalytics #DataDrivenDecisions). With this valuable data readily available, you can gain actionable insights to optimize your store and maximize your return on investment (ROI).
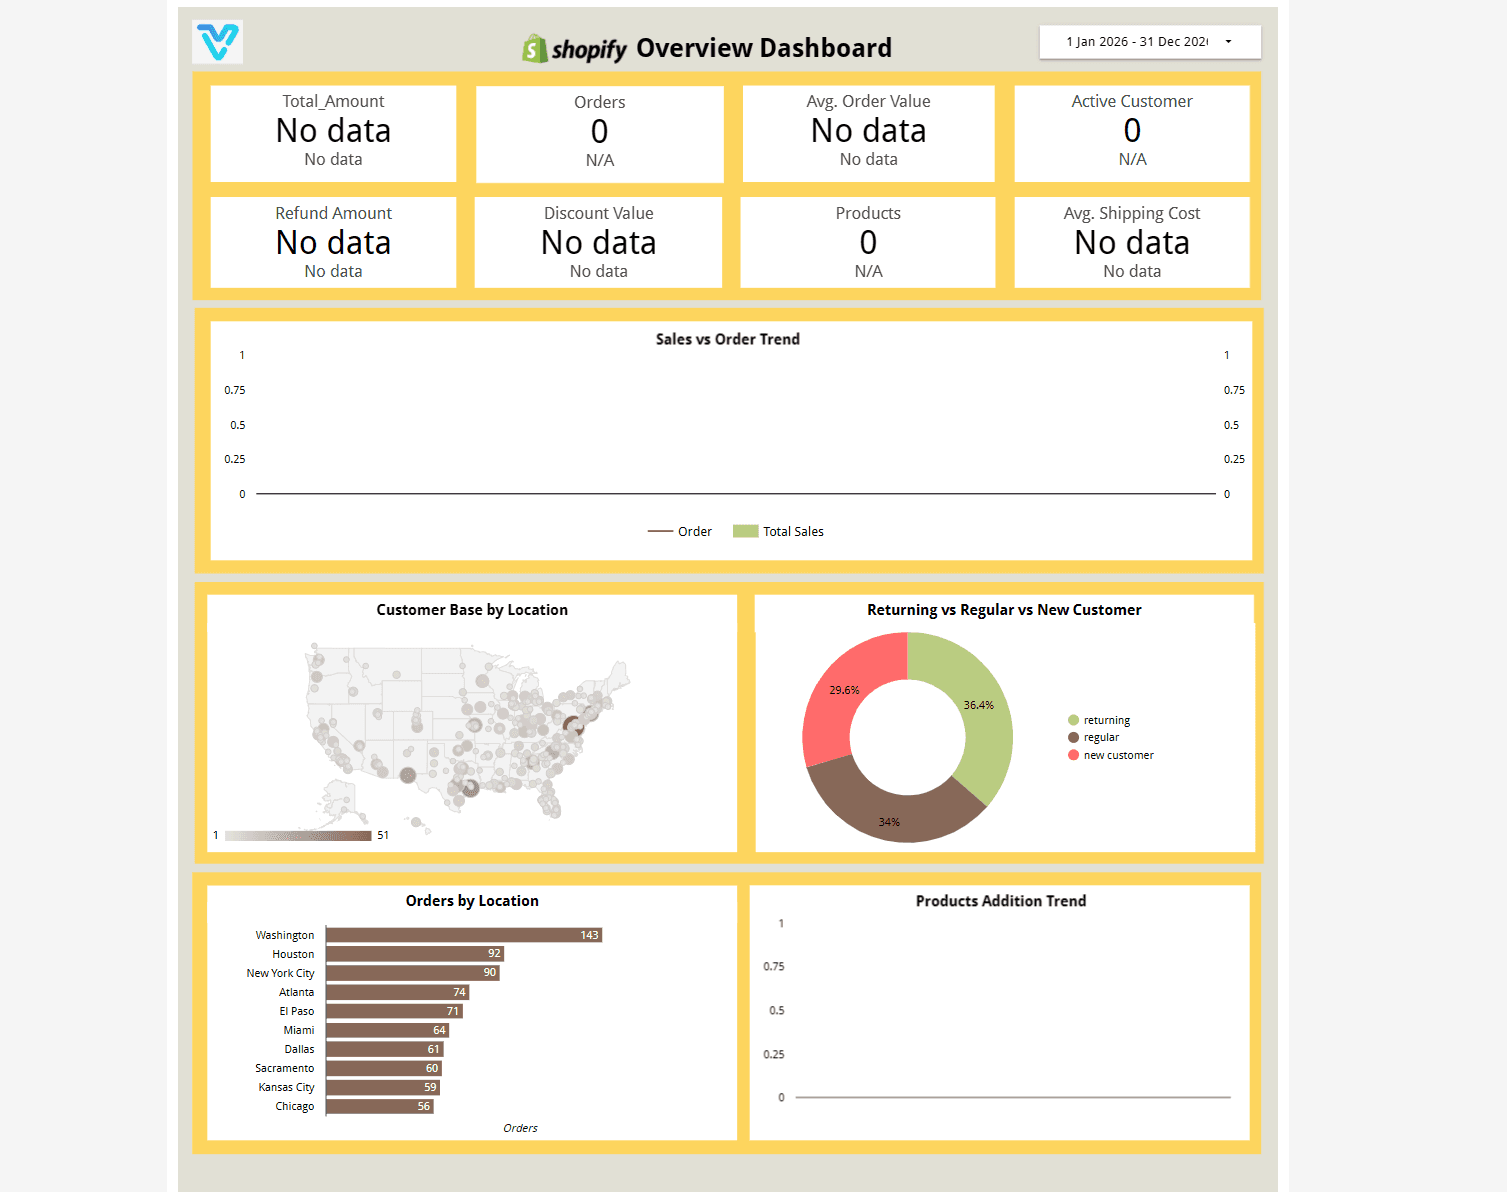
Built in Looker Studio with Shopify KPI tracking for revenue, orders, average order value, conversion rate, and customer trends.
Trusted by teams across 15+ countries
Explore the core Shopify store performance dashboard views built for ecommerce and leadership decisions.
Interactive Shopify ecommerce reporting view.
Open the live embedded finance dashboard directly in a fullscreen modal.
Track revenue, orders, average order value, conversion rate, and customer trends in one decision-ready view.
$2.4M
▲ The total revenue generated from all sales within a specific period. Tracking this KPI helps assess overall store performance and revenue growth, driving data-backed business decisions.
12.8K
▲ The count of unique customers who made purchases within a defined period. This KPI highlights customer loyalty, engagement, and helps assess the effectiveness of retention strategies
$740K
▲ The total number of orders placed in your store. Monitoring this KPI is essential for understanding customer demand and evaluating sales trends, enabling efficient inventory and order management.
24%
▲ The total value of refunds issued. Tracking this KPI helps identify potential product or service issues, optimize the return process, and improve customer satisfaction.
99.2%
▲ A key metric showing the average dollar amount customers spend per order. Increasing AOV can improve profitability by encouraging larger purchases and effective upselling strategies.
$1.2M
▲ The average cost incurred for shipping per order. Monitoring this KPI helps optimize shipping strategies, reduce costs, and improve customer satisfaction through faster, cost-effective delivery solutions.
These are the practical Shopify reporting challenges this dashboard helps teams resolve.
Teams lose speed when Shopify revenue, order, and customer metrics are spread across disconnected exports.
A centralized dashboard helps identify conversion and basket-value changes earlier so optimization can happen faster.
Automated reporting reduces repetitive exports and frees teams to focus on performance optimization.
How this dashboard helps ecommerce teams move from fragmented Shopify exports to faster, data-backed growth decisions.
Finance teams often struggle with delayed reporting, fragmented sources, and low confidence in KPI consistency.
This dashboard centralizes financial metrics in one view with real-time updates and consistent definitions. Want a Shopify reporting setup like this? See our marketing dashboard & reporting automation service.
Find answers to common questions about this finance dashboard.
It consolidates Shopify KPIs into one reporting view so teams can monitor revenue, orders, conversion rate, and customer trends without manual exports.
From Lets Viz
Experience superior data analysis with our custom dashboards. Specializing in all tools and technologies, we turn data into visually compelling, actionable insights
NDA-safe · No obligation · Clear next steps