Sales
$2.4M
▲ Total revenue generated from products or services, indicating demand and business growth.
Sales Dashboard empowers you to make informed, data-driven decisions. Access powerful analytics, track performance in real time, and visualize key metrics to enhance your sales strategies. Streamline reporting and uncover actionable insights that help optimize your sales team’s performance and drive growth.
Track sales, quantity, profit, shipping cost, and profit ratios in one live dashboard view.
Built for sales teams with live KPI tracking and profitability drill-down analysis.
Trusted by teams across 15+ countries
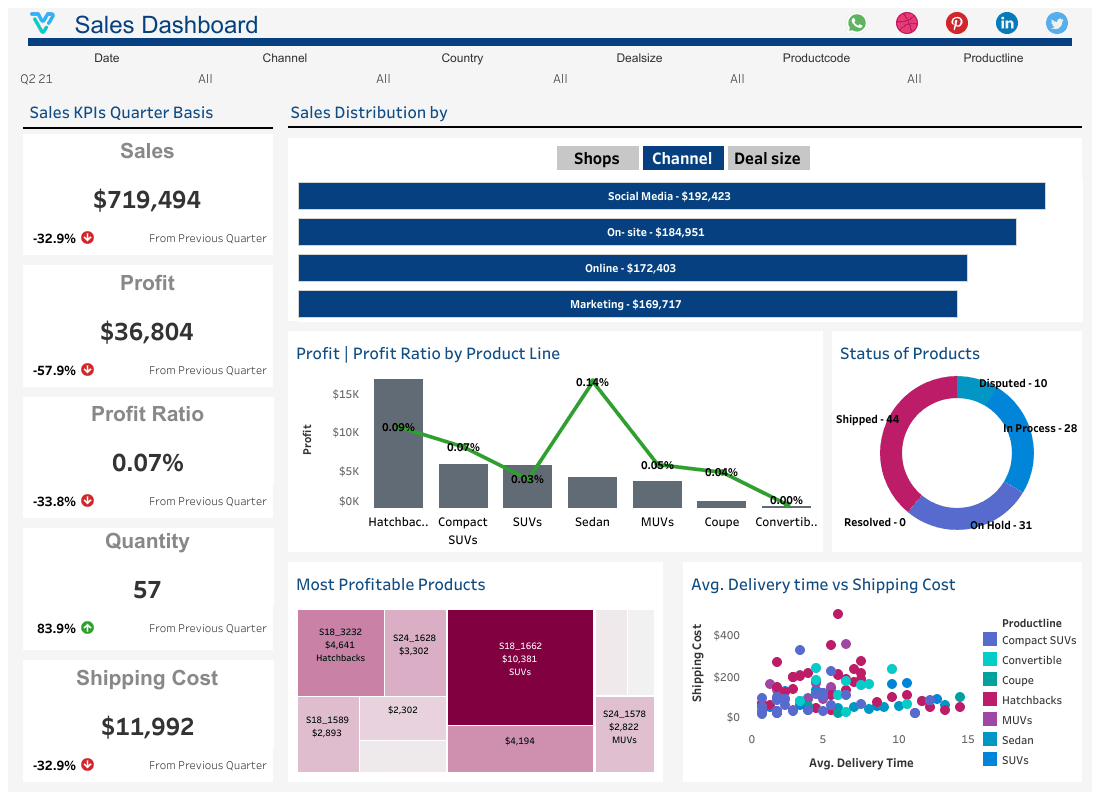
Explore the core sales dashboard views built for revenue and profitability decisions.
Interactive sales reporting view.
Open the live embedded sales dashboard directly in a fullscreen modal.
Track sales, quantity, profit, shipping cost, and product-line profitability in one place.
$2.4M
▲ Total revenue generated from products or services, indicating demand and business growth.
48.6K
▲ Total number of units sold, indicating product demand and sales volume.
18%
▲ Total earnings after deducting all expenses, reflecting the financial success and sustainability of the business.
$1.2M
▲ Total expenses incurred for shipping products to customers, impacting overall profitability.
18%
▲ Percentage of profit relative to sales, measuring the efficiency of revenue generation and cost management.
18%
▲ Profit margin segmented by different product categories, helping identify the most profitable lines and optimize product strategy.
These are the practical sales challenges this dashboard helps teams resolve.
Sales Dashboard integrates key metrics such as Sales Volume , Profit , and Profit Ratio , giving businesses a clear view of sales effectiveness. Teams can identify if increased sales are translating to increased profits or if sales volume is being driven by low-margin products.
Sales Dashboard helps segment customers based on shipping costs and product quantity, making it easier to identify customer segments where shipping costs are particularly high or profits are lower, enabling businesses to adjust strategies accordingly.
Sales dashboards provide a unified view of sales data, ensuring consistent insights across the entire team, eliminating discrepancies that can hinder decision-making.
Sales Dashboard , advanced data visualization tools help identify patterns in sales trends, allowing businesses to quickly adapt their strategies based on insights.
It enables users to customize dashboards to meet specific needs, ensuring that sales data is presented in the most meaningful and actionable way possible.
Sales Dashboard provides real-time insights into sales, profit, and profit ratios, enabling businesses to track profitability over time. This helps identify whether profit margins are increasing or decreasing and what actions need to be taken.
Key Details
Key sales dashboard capabilities with context from the source page.
Total revenue generated from products or services, indicating demand and business growth.
Total number of units sold, indicating product demand and sales volume.
Total earnings after deducting all expenses, reflecting the financial success and sustainability of the business.
Total expenses incurred for shipping products to customers, impacting overall profitability.
Percentage of profit relative to sales, measuring the efficiency of revenue generation and cost management.
Profit margin segmented by different product categories, helping identify the most profitable lines and optimize product strategy.
How this dashboard helps sales teams move from fragmented reporting to faster, profit-aware decisions.
Sales teams often struggle with scattered metrics, delayed trend visibility, and low confidence in profitability tracking.
This dashboard centralizes sales and profitability KPIs in one live view for faster commercial decisions. Want a sales dashboard like this for your team? Browse more examples in our Zoho dashboard gallery.
Find answers to common questions about this sales dashboard.
The Sales Dashboard is designed to provide businesses with real-time insights into key sales metrics, including sales, profit, profit ratio, quantity sold, and shipping costs. It helps you make data-driven decisions to optimize performance and profitability.
From Lets Viz
Experience superior data analysis with our custom dashboards. Specializing in all tools and technologies, we turn data into visually compelling, actionable insights
NDA-safe · No obligation · Clear next steps