Solved Requests
$2.4M
▲ It refers to the customer service tickets that have been successfully closed and resolved to the customer’s satisfaction.
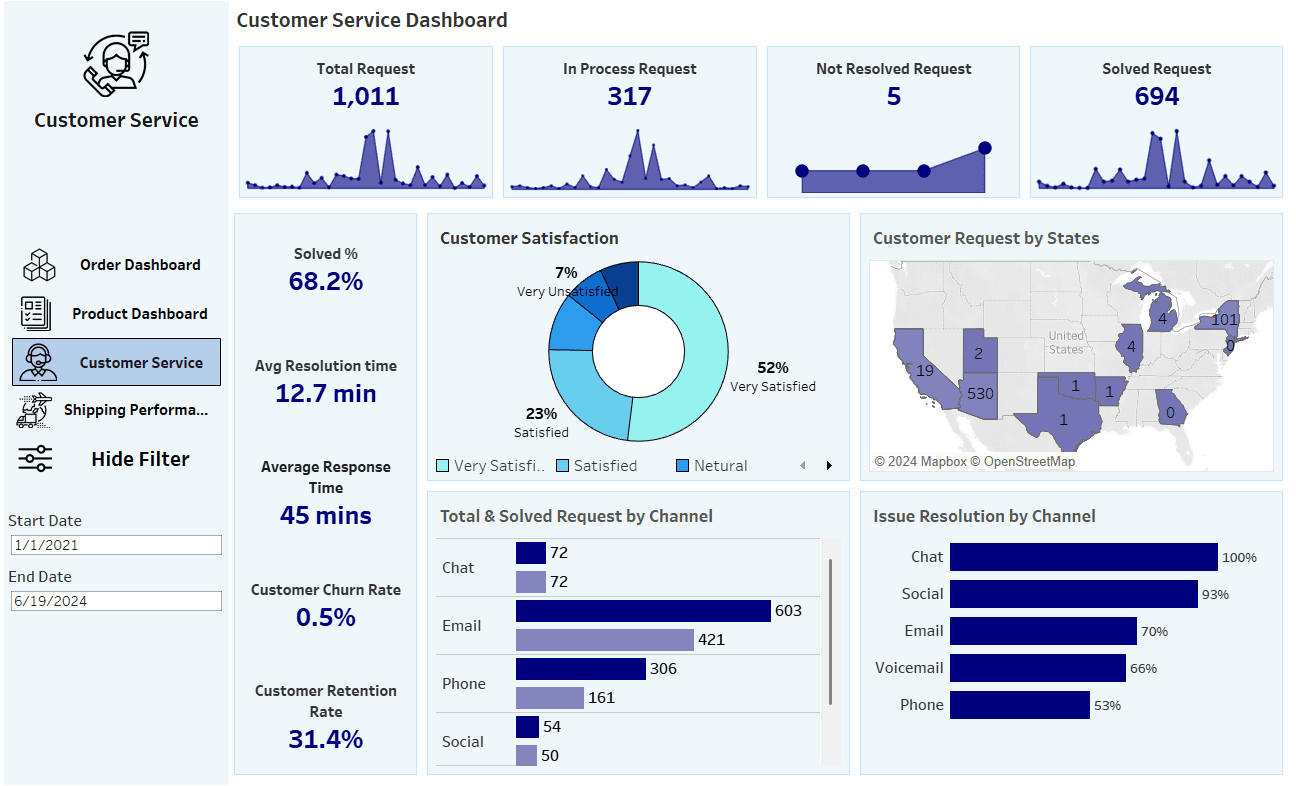
Unlock the power of seamless customer support with our Customer Service Dashboard! Dive into a world of real-time insights, where every interaction, and every detail matters. Track tickets, monitor response times, and optimize your processes for faster resolutions, improved efficiency, and happier customers.
Track ticket volume, resolution time, SLA adherence, CSAT, and support team performance in one live dashboard view.
Built for support teams with centralized service KPI tracking and case-level drill-down visibility.
Trusted by teams across 15+ countries
Explore the core customer service dashboard views built for support operations and leadership decisions.
Interactive customer service reporting view.
Open the live embedded customer service dashboard directly in a fullscreen modal.
Track service quality, ticket operations, and support efficiency KPIs in one decision-ready view.
$2.4M
▲ It refers to the customer service tickets that have been successfully closed and resolved to the customer’s satisfaction.
18%
▲ The average amount of time it takes for customer service agents to resolve a ticket, from when the request is opened to when it is closed.
6.4%
▲ It refers to the percentage of customers who stop using a company’s services or products within a given period.
24%
▲ It refers to the tickets that are currently being worked on by customer service agents. These are requests that have not yet been resolved.
99.2%
▲ The average time taken by agents to respond to a customer’s initial request.
2.1x
▲ the percentage of customers who continue to use your service or product over a given period.
These are the practical customer service reporting challenges this dashboard helps teams resolve.
Without a unified dashboard, teams struggle to prioritize open tickets and detect service bottlenecks early.
Fragmented support reports make it difficult to monitor first response time, resolution speed, and SLA performance consistently.
A centralized customer service dashboard helps teams track CSAT and agent-level outcomes in one decision-ready view.
Key Details
Key customer service dashboard capabilities with context from the source page.
How this dashboard helps support teams move from fragmented service reporting to faster, better customer outcomes.
Finance teams often struggle with delayed reporting, fragmented sources, and low confidence in KPI consistency.
This dashboard centralizes financial metrics in one view with real-time updates and consistent definitions. Want a customer-service dashboard like this for your team? Browse more examples in our Tableau dashboard gallery.
Find answers to common questions about this finance dashboard.
The Customer Service Dashboard is designed to provide a real-time overview of customer support activities. It tracks key metrics such as ticket volumes, resolution times, customer satisfaction, agent performance, and more. This helps businesses monitor and optimize their customer service operations, ensuring timely and effective support.
From Lets Viz
Experience superior data analysis with our custom dashboards. Specializing in all tools and technologies, we turn data into visually compelling, actionable insights
NDA-safe · No obligation · Clear next steps