Packages Shipped (YTD)
18%
▲ Total number of packages shipped year-to-date, indicating operational capacity and fulfillment efficiency.
Boost your logistics performance with our comprehensive Logistics Dashboard. Track shipments, optimize inventory, and analyze supply chain metrics. Empower your business with real-time insights and drive operational excellence. Transform logistics management with our cutting-edge Logistics Dashboard.
Track packages shipped, material usage, packaging cost, damages, and logistics efficiency in one Power BI logistics view.
Built in Power BI with real-time logistics KPI tracking and operational drill-down analysis.
Trusted by teams across 15+ countries
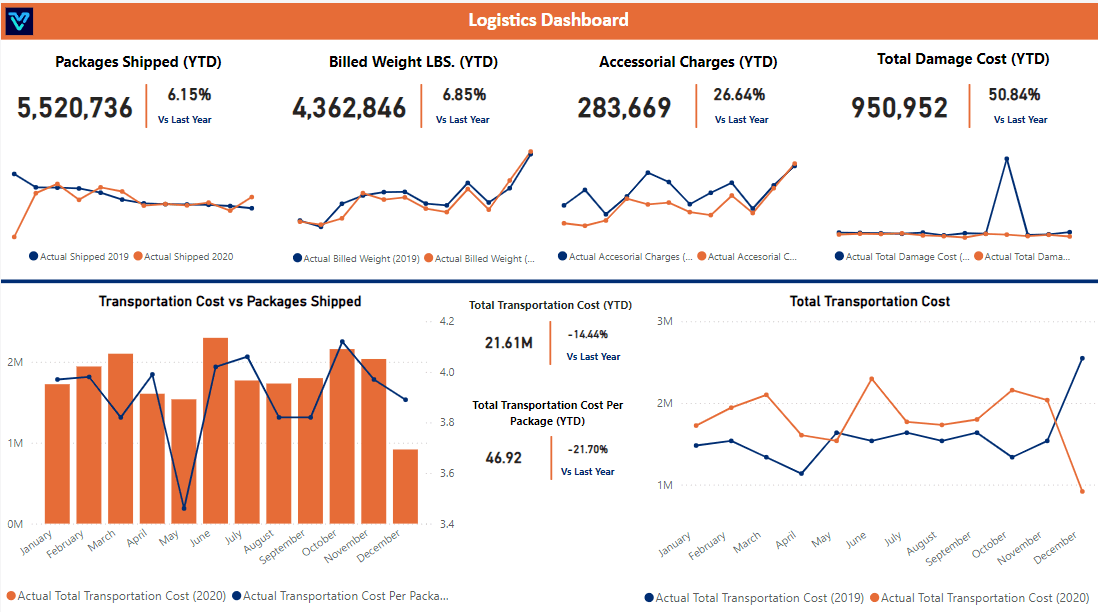
Explore the core Power BI logistics dashboard views built for operations and supply-chain decisions.
Interactive Power BI logistics reporting view.
Open the live embedded Power BI logistics dashboard directly in a fullscreen modal.

Track packages shipped, material volume, packaging cost, damage cost, and related logistics KPIs in one place.
18%
▲ Total number of packages shipped year-to-date, indicating operational capacity and fulfillment efficiency.
$740K
▲ Aggregate volume of materials used for packaging year-to-date, measuring resource utilization and storage requirements.
$1.2M
▲ Average material cost for each package shipped year-to-date, reflecting cost efficiency in packaging.
$1.2M
▲ Overall expenditure on packaging materials year-to-date, providing insights into budget allocation and cost management
2.1x
▲ Total distinct packaging items used year-to-date, indicating product diversity and inventory complexity.
$2.4M
▲ Total volume of film used in packaging year-to-date, reflecting specific material usage and efficiency.
These are the practical logistics challenges this dashboard helps teams resolve.
Without a single KPI view, teams cannot quickly identify weak links across procurement, transport, and storage.
Logistics businesses need a unified system where every operational metric is consistently measured and reviewed.
When one part of the supply chain underperforms, teams need immediate KPI visibility to find root causes faster.
A simplified KPI display is necessary to spot logistics issues early and prioritize corrective actions.
Pointer Sectin
Key logistics dashboard capabilities with context from the source page.
The Logistics Dashboard helps measure KPIs across shipping and supply-chain steps in one place.
Track sales, costs, net profit ratio, shipments, average delivery times, order status, and inventory metrics.
The dashboard supports deeper analysis by allowing users to click into specific metrics and views.
With operational visibility and faster KPI interpretation, teams can optimize supply-chain performance.
How this dashboard helps operations teams improve shipping, packaging, and cost control with centralized KPI visibility.
Logistics teams often struggle with limited visibility, rising packaging costs, billing complexity, and delayed issue detection across operations.
This dashboard centralizes shipping, packaging, damage, and cost KPIs in one Power BI logistics view for faster operational decisions. Need a logistics dashboard like this for your operations? See our Managed Power BI service.
Find answers to common questions about this logistics dashboard.
Lack of Real-Time Visibility A logistics dashboard solves the issue of poor visibility by providing real-time data on shipments, billed weights, and accessorial charges, allowing stakeholders to monitor operations instantly. Inefficient Resource Allocation With accurate tracking of packages shipped and billed weights, businesses can optimize warehouse resources and delivery routes, reducing unnecessary overhead and operational costs.
From Lets Viz
Experience superior data analysis with our custom dashboards. Specializing in all tools and technologies, we turn data into visually compelling, actionable insights
NDA-safe · No obligation · Clear next steps