Search Volume
126K
▲ The number of searches for specific keywords over a period, indicating potential traffic and interest levels.
This SEO dashboard gives you live visibility into impressions, clicks, CTR, average position, top queries, landing pages, conversions, and SEO-attributed pipeline —all in one view. CMOs and SEO leads use it to prove impact and fix issues fast (declining CTR, cannibalization, page drops). We implement and automate this SEO reporting dashboard in your GA4 + Search Console stack, so you stop building slides every week.
Built on GA4 + Search Console with SEO-focused KPI tracking and drill-down analysis.
Trusted by teams across 15+ countries
Explore SEO dashboard views built for visibility into rankings, traffic quality, and conversion impact.
Interactive SEO reporting view.
Open the live embedded finance dashboard directly in a fullscreen modal.
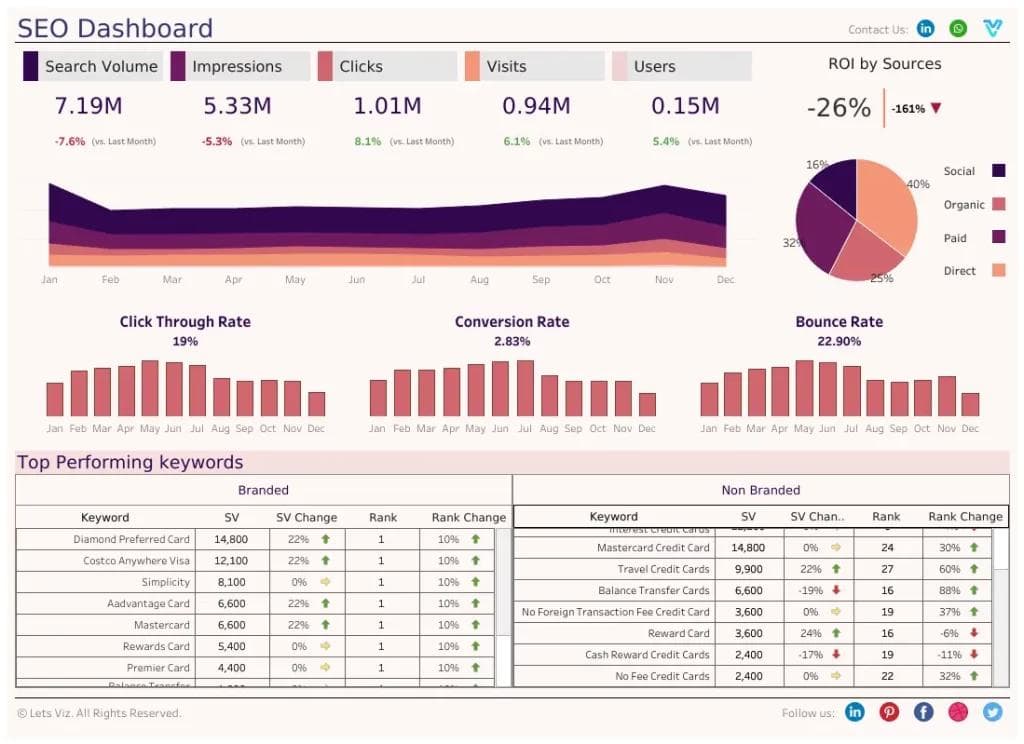
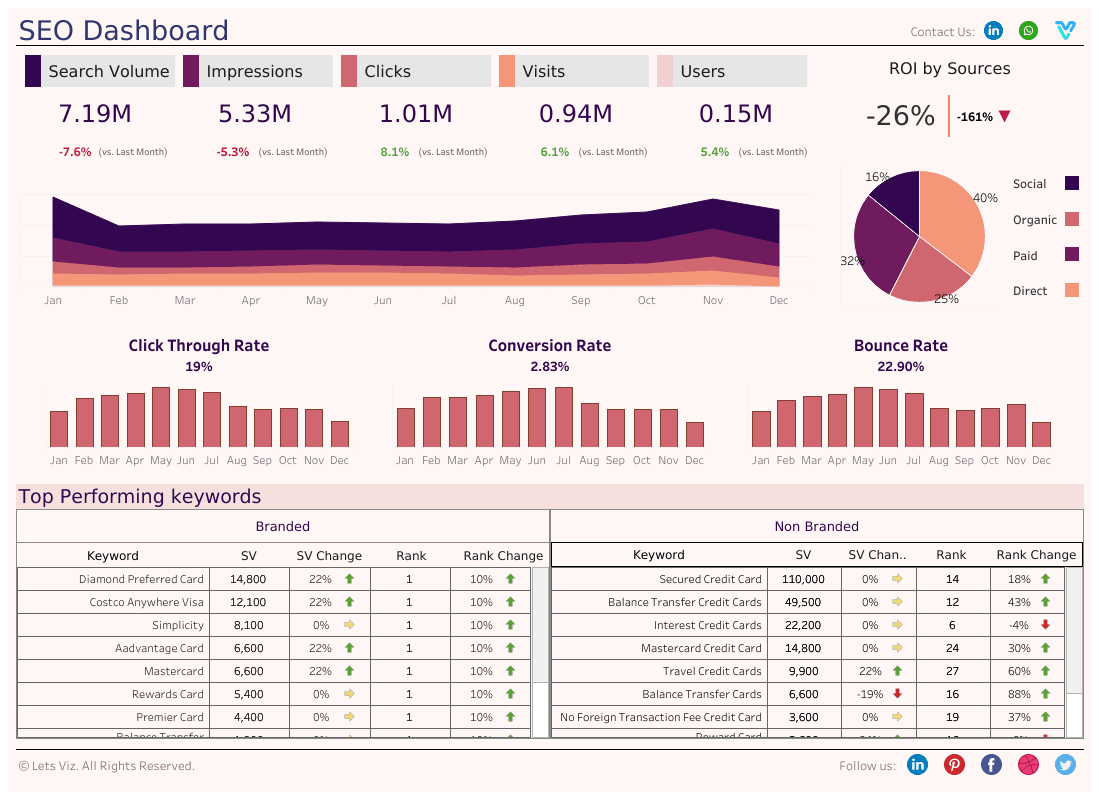
Track search volume, clicks, CTR, users, visits, conversion rate, and bounce rate in one unified SEO report.
126K
▲ The number of searches for specific keywords over a period, indicating potential traffic and interest levels.
4.2x
▲ Return on investment calculated per user, measuring the financial effectiveness of your SEO efforts.
126K
▲ Number of times users click on your site from search results, indicating interest and engagement.
126K
▲ Percentage of clicks relative to impressions, gauging how effectively your search listings attract clicks.
84K
▲ Total number of user sessions on your site, providing insights into overall traffic.
3.9%
▲ Percentage of visits leading to conversions, indicating the success of your site in achieving desired actions.
41K
▲ The number of unique visitors to your site, reflecting audience size and reach
5.8%
▲ Percentage of single-page sessions, showing how effectively your site retains visitors and encourages further exploration.
These are the practical SEO reporting challenges this dashboard is built to solve.
With so much data available, it can be overwhelming and time-consuming to sift through it all and identify the most critical metrics. But with Let’s Viz SEO dashboards, it is easy as cutting a cake with a sword. As we see in Google Analytics 4 and the search console is full of data, especially when we have to make some critical decisions based on SEO data, our customized SEO dashboard gives reports based on webmaster requirements.
Data is often stored in multiple platforms and tools ( like Google Analytics4, Google search console, Semrush & Ahref, and many others ), making it difficult to view website performance comprehensively. Our SEO dashboards bring all the data together on a single screen.
Only some people have the technical expertise to understand and analyze website data, like your clients; the juniors are still learning, or those who have just started their business need to become more familiar with critical metrics of SEO and its performance criteria. It can lead to incorrect interpretations. Our SEO dashboards make it super, super simple so that everyone can understand things with just basic knowledge of SEO. Now you can clearly understand your clicks, impressions, keyword search volume, conversion trend change, and traffic source.
With so many metrics to track, it can be difficult to identify which ones are most important and relevant to the business goals. Our experts know the important metrics and KPIs that need to be highlighted the most.
Traditional data analysis tools may not provide visual representations of data, making it difficult to quickly identify trends and patterns. Our dashboards make it super simple as the data is presented in visual charts and graphs.
Understanding the competition and tracking their SEO efforts can be difficult, as it requires monitoring multiple data sources and tools. With our experts, even this becomes a lot easier and faster.
Why choose us
All major SEO dashboard points summarized as concise bullets.
Out of all the things, what makes us the best is our SEO experts. For SEO industry, we have specialized experts who have trained and practiced for years in the SEO industry and know how the visualization of SEO metrics and KPIs differ from others.
Just like there is no one-man army at Let’s Viz , there is no one template for all. You get the most detailed and SEO-centric designed dashboards which cover all aspects and important KPIs of SEO.
Ensure that all data is securely stored and protected, using the latest encryption and security protocols, to provide peace of mind to users.
You get dedicated account managers, 24/7 support, and onboarding assistance to ensure users have the help they need to get the most out of the visualised SEO dashboards.
We take your data very seriously and securely integrate your data with the appropriate sources in the organization. We maximize on protection yet work in safe sharing of data for further analytics and other services.
Allow users to set up customized alerts and notifications that inform them of any changes in their website performance or other important metrics.
How this dashboard helps SEO teams move from fragmented reporting to faster decisions.
SEO teams often struggle with fragmented data, delayed reporting, and low confidence in KPI consistency.
This dashboard centralizes SEO metrics in one view with live visibility and consistent definitions. Need an SEO reporting setup like this? Browse more examples in our Tableau dashboard gallery.
Find answers to common questions about this finance dashboard.
When we talk about SEO dashboard, it is a tool that can help you to visualize the performance of the website for the search engines using different metrics like graphs, charts, etc.
From Lets Viz
We connect GA4 + Search Console and automate your weekly SEO reporting inside your stack.
NDA-safe · No obligation · Clear next steps