Power BI Dashboards Leaders Actually Use: A Build Guide
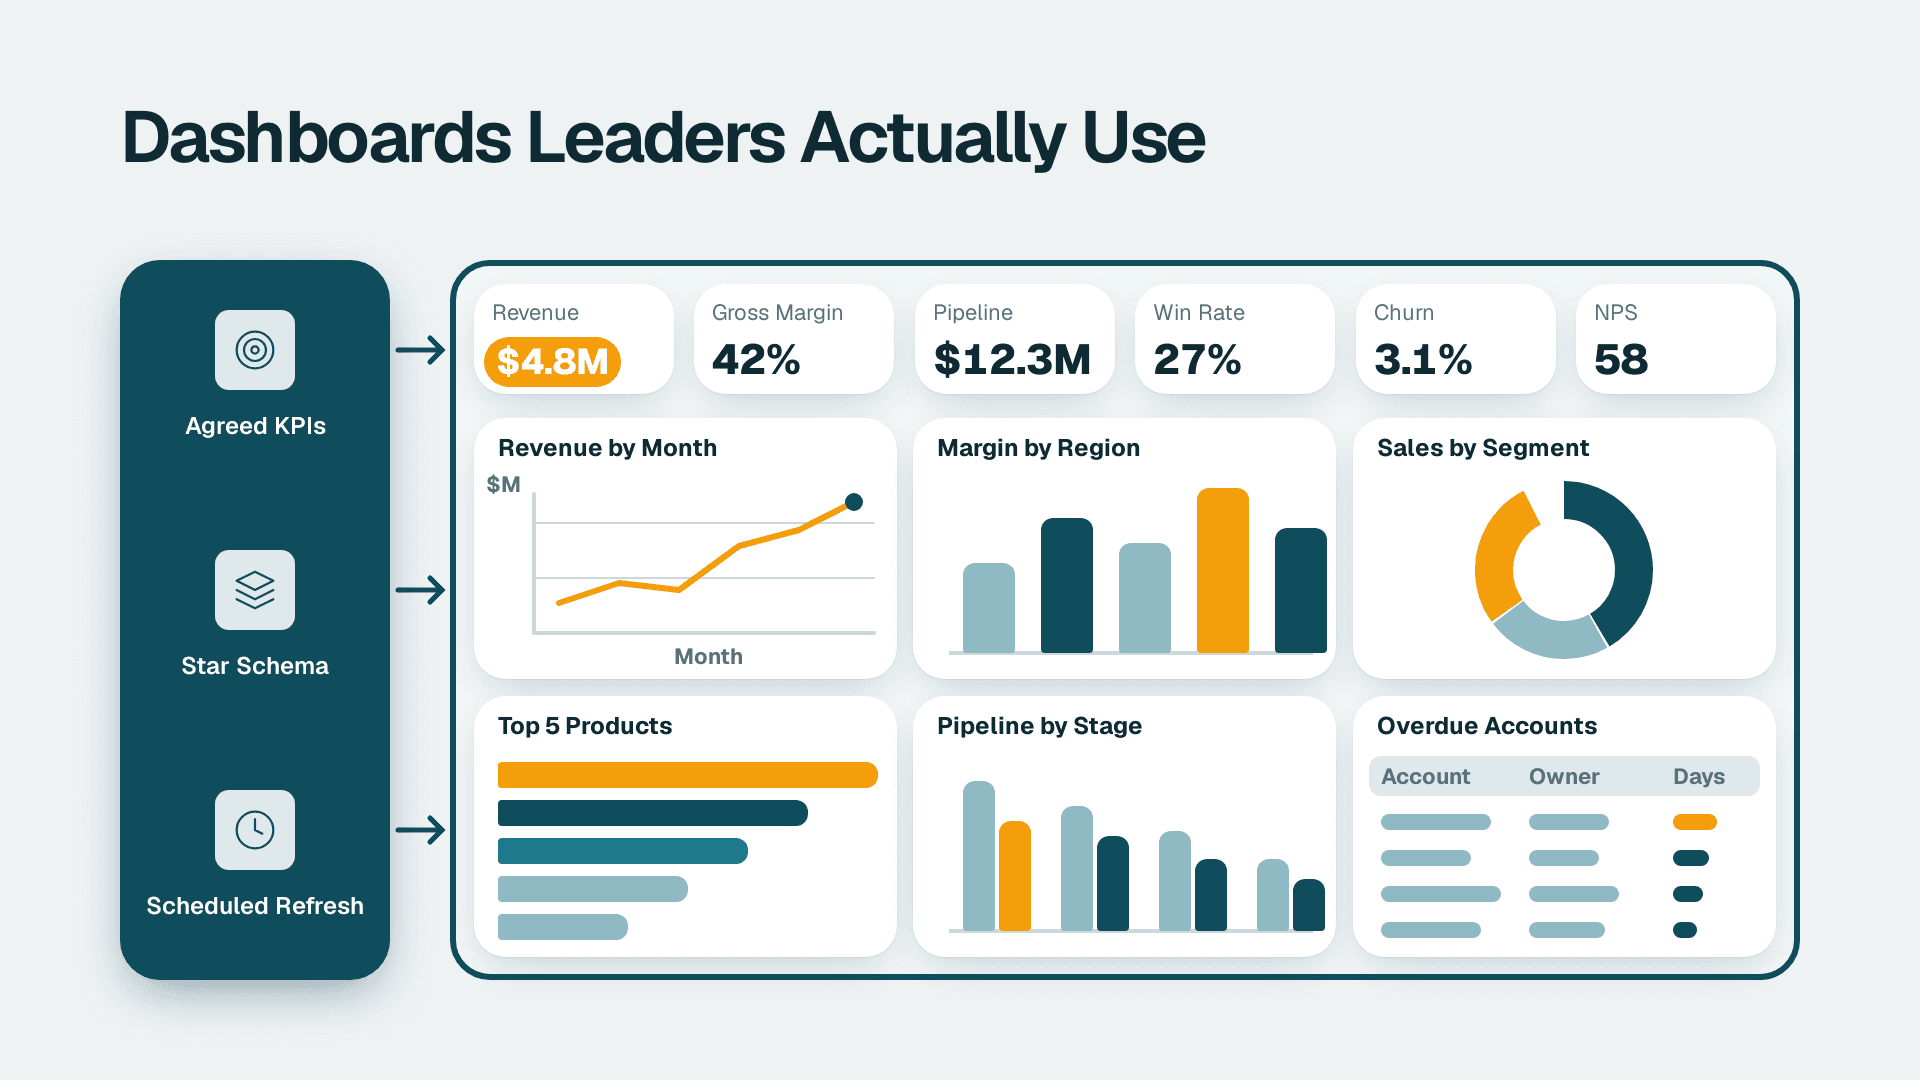
A Power BI dashboard that leaders use starts with five to eight agreed KPIs, not with visuals. Define each metric with an owner and a source, build a star-schema data model so the numbers reconcile, lay out the page so the answer is visible in seconds, schedule refresh to match the decision cadence, and roll out with training and a usage review.
Key Takeaways
- Agree the KPIs, their definitions and their owners before anyone opens Power BI Desktop.
- A star-schema data model with measures (not calculated columns) keeps numbers consistent and fast.
- Put the headline answer top left, limit the page to a handful of visuals, and design for the meeting where it will be used.
- Match refresh frequency to how often the decision is made, and decide up front whether you need write-back.
- Rollout is where most dashboards fail: assign an owner, train users, and review usage after 30 and 90 days.
What are Power BI dashboards, and what do leaders really mean by the term?
In Microsoft's terms, a Power BI dashboard is a single page, often called a canvas, that tells a story through visualizations. In everyday conversation, though, executives use the word for any screen of charts, whether it is technically a dashboard or a multi-page report. Settling that vocabulary early saves a lot of rework.
The distinction matters because the two have different capabilities. According to Microsoft Learn, dashboards are a feature of the Power BI service and are not available in Power BI Desktop. The visualizations on a dashboard are called tiles, and tiles are pinned from reports, each of which is based on a semantic model. A dashboard can draw on one or many semantic models and reports, while a report is based on a single semantic model. You can't filter or slice a dashboard, and drilling down is only possible if you pin an entire report page.
That last point is the one that surprises people. If your leaders expect to click a region and see everything update, they want an interactive report, not a pinned-tile dashboard. Many teams therefore build a report for exploration and, when needed, pin a few headline tiles to a dashboard in the Power BI service as the landing view. Teams that want an experienced partner to shape this structure often start with Power BI consulting, but the planning steps below work whether you build in-house or not.
Here is a quick comparison to anchor the vocabulary:
| Feature | Dashboard (service) | Report |
|---|---|---|
| Pages | One canvas | One or many pages |
| Built in | Power BI service only | Desktop or service |
| Data sources | One or many semantic models | One semantic model |
| Filtering and slicing | Not available | Fully interactive |
| Drill-down | Only if a whole report page is pinned | Available |
| Best for | At-a-glance monitoring | Exploration and analysis |
Who can build one? Per the same Microsoft documentation, creating a dashboard is a creator feature that requires edit permissions on the report. A Power BI Pro or Premium Per User (PPU) licence is needed to create dashboards in workspaces, although you can build in your own My Workspace without one.
How do you choose the KPIs first?
Start with the decisions, not the data. Ask each leader which three decisions they make weekly or monthly, then work backwards to the numbers that would change those decisions. Anything that does not change a decision does not belong on the page.
A workable process looks like this:
1. List the decisions. For example: whether to hire, whether to chase a late receivable, whether to reorder stock.
2. Name the KPI behind each decision. Cap the list at five to eight.
3. Write a definition for each. Specify the formula, the filters, the time grain and the source system.
4. Assign an owner. One named person answers when the number is questioned.
5. Set targets and thresholds. A number without a target is trivia; leaders need to know whether it is good or bad.
Use a simple KPI card to capture this before development begins:
| Field | What to record | Example (hypothetical) |
|---|---|---|
| KPI name | The label leaders will see | Days sales outstanding |
| Decision supported | Why it exists | Whether to tighten credit terms |
| Definition | Formula and filters | Open receivables divided by credit sales, times days in period |
| Source | System of record | ERP accounts receivable ledger |
| Owner | Accountable person | Finance manager |
| Target and threshold | Green, amber, red rules | Set by the CFO |
| Refresh need | How fresh is useful | Daily |
This is the step most teams skip, and it is the root of most arguments later. If marketing and finance each calculate "revenue" differently, no layout will rescue the dashboard. Our guide on building a KPI dashboard leadership actually uses goes deeper on choosing and governing the metric set.
A few practical rules help here. Prefer ratios and trends over raw totals, because leaders read direction faster than magnitude. Show the comparison that matters, such as versus target or versus the same period last year. And resist the "just in case" metric: every extra KPI dilutes the ones that matter.
How should the data model behind Power BI dashboards be built?
Build a star schema: narrow fact tables holding events or transactions, surrounded by dimension tables such as date, customer, product and account. It is the shape Power BI's engine handles best, and it makes the numbers predictable because every filter flows in one clear direction.
The common failure is loading one wide, flattened export from a source system and calculating everything on top of it. It works for a prototype and then collapses when a second data source arrives. A better approach:
- Model once, reuse often. Build a certified semantic model and let multiple reports connect to it, so the definitions live in one place.
- Create a proper date table. Mark it as a date table and relate every fact table to it. Time intelligence depends on it.
- Keep relationships simple. Prefer one-to-many, single-direction relationships. Resolve many-to-many with a bridge table.
- Clean in the source or in Power Query. Fix types, remove duplicates and standardise names before data reaches the model.
- Hide what leaders should never see. Key columns and helper fields clutter the field list and invite misuse.
If the data is not yet trustworthy, no dashboard design will help. A reconciliation habit pays for itself: our 7-step reconciliation for reports that disagree with the general ledger shows how to tie a model back to the books before leaders see a single figure.
When should you use calculated columns versus measures in DAX?
Use a measure for anything that aggregates or responds to filters, and a calculated column only when you need a fixed value per row that you will slice, filter or relate on. Measures are computed at query time and take no storage; calculated columns are computed at refresh and are stored in the model, which increases its size.
| Question | Calculated column | Measure |
|---|---|---|
| When is it computed? | At data refresh | At query time, in the current filter context |
| Stored in the model? | Yes, per row | No |
| Reacts to slicers and filters? | No, it is fixed per row | Yes |
| Typical use | Category bucket, row-level flag, sort key | Totals, ratios, year-to-date, variance to target |
| Can be used on an axis or slicer? | Yes | No |
A useful rule of thumb: if the result is a number a leader will read on a card or chart, it should almost always be a measure. If you need to group rows into bands (for example, ageing buckets on invoices), a calculated column or, better, a column prepared upstream is appropriate.
When a page feels slow, the culprit is usually a handful of expensive measures. Using DAX Studio to find and fix slow measures is the practical way to diagnose them before users complain.
What layout makes a dashboard leaders actually use?
Put the answer where the eye lands first, and let everything else support it. Leaders open a dashboard with a question in mind; the layout should answer it within about five seconds and make the next question easy to reach.
A dependable structure for a single page:
- Top row: headline KPI cards. Four to six cards showing the current value, the comparison and a clear status colour.
- Middle: one or two trend visuals. A line chart for time and a bar chart for ranking usually do the job.
- Bottom or right: detail on demand. A table or a drill-through page for those who need it.
- Left or top: minimal filters. Offer only the slicers a leader would genuinely use, such as period and business unit.
Design choices that consistently help:
1. Limit visuals. Roughly six to nine on a page is plenty. More invites scanning without reading.
2. Use colour for meaning. Reserve red and green for status. Keep everything else neutral.
3. Label plainly. Titles should state the takeaway or the measure, not the chart type.
4. Design for the device. If leaders open it on a phone, build a mobile layout. Microsoft notes you can't create dashboards on mobile devices, but you can view and share them there.
5. Test with a real leader. Watch them use it for two minutes without explanation. Where they hesitate, redesign.
What do good Power BI financial dashboard examples include?
Strong Power BI financial dashboard examples share a pattern: a P&L summary against budget, a cash position with a short forecast, working-capital measures such as receivables ageing, and a variance view that lets a finance manager click from a headline number down to the accounts behind it. A US SaaS finance team, for instance, might lead with recurring revenue and cash runway, while a Canadian manufacturing company might lead with gross margin by product line and inventory days.
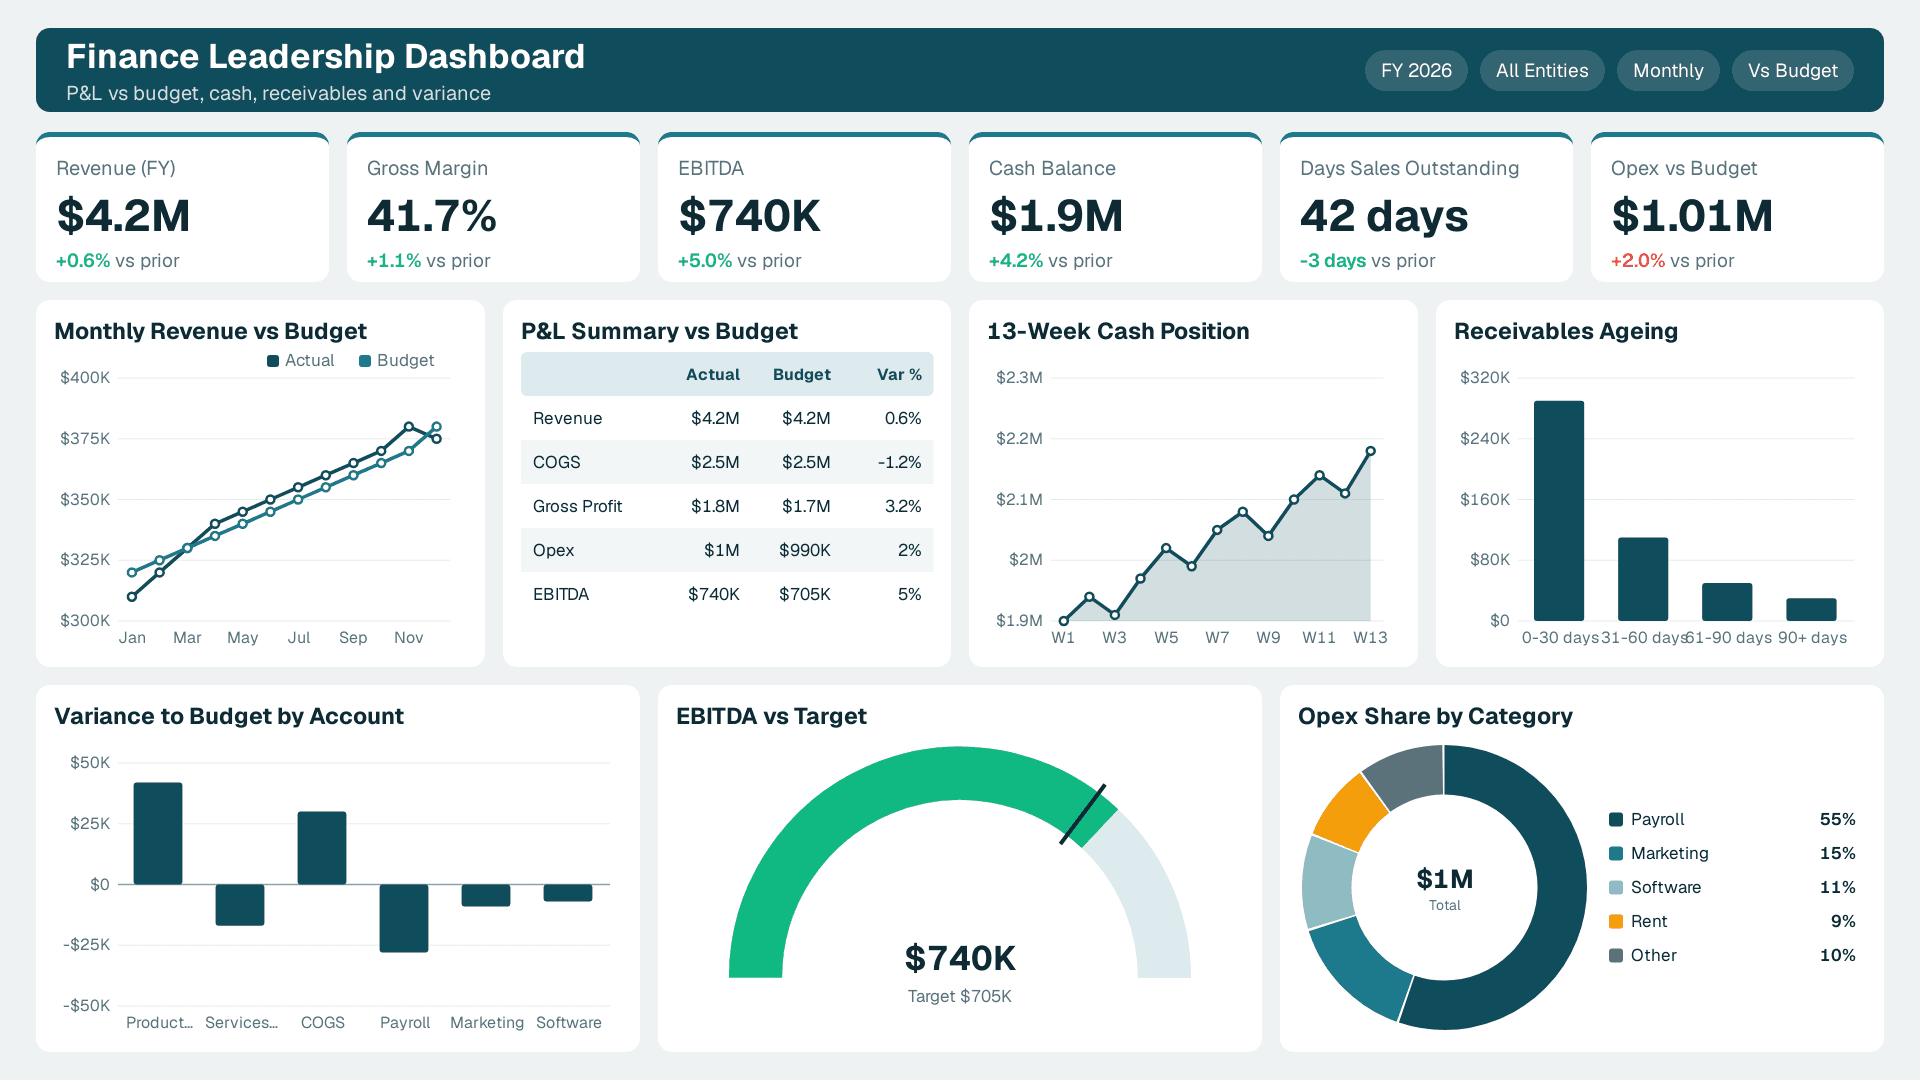
The design principle is the same in each case: headline first, variance second, detail on demand. You can browse the kind of layouts that work on our dashboard examples page, then adapt the structure to your own KPI card rather than copying the visuals.
Finance leaders also care about traceability. If a figure is questioned in a review, the model should let someone follow it to the ledger. That discipline links directly back to the reconciliation work above.
How often should Power BI dashboards refresh, and do you need write-back?
Refresh as often as the decision is made, and no more. A weekly operations review does not need hourly data, and an unnecessary schedule only adds load and cost. The right question is: what is the oldest the data can be before a leader makes a bad call?
Match cadence to the use case:
| Use case | Typical cadence | Notes |
|---|---|---|
| Monthly board pack | After close | Refresh once the books are locked |
| Weekly sales or ops review | Daily overnight | Ready before the first meeting |
| Cash and receivables monitoring | Daily or several times a day | Depends on how fast the source updates |
| Operational floor monitoring | Near real time | Needs a streaming or direct-query design |
A few practical points. Microsoft states that a dashboard combines on-premises and cloud data and that its tiles update as the underlying data changes, so the freshness of the tile is really the freshness of the semantic model behind it. Use an incremental approach for large fact tables so you refresh only recent partitions. Set up failure notifications so a broken refresh reaches the model owner, not a confused executive. And show a "data last refreshed" label on the page so nobody guesses.
If your inputs come from spreadsheets, the guide to connecting Excel to Power BI with automatic refresh covers the gateway and storage choices that keep those files from silently going stale.
What are the Power BI write-back to database options?
Power BI is a read-oriented tool, so write-back needs an additional component. Teams that need budget inputs, forecast adjustments or approval notes typically choose among a few patterns, and the right one depends on governance and volume:
- An embedded app visual. A low-code app sits inside the report so users enter values that are saved to a database table, which the model then reads on its next refresh.
- A workflow automation. A button or trigger launches a flow that writes the user's input or decision to a database or list.
- A purpose-built write-back extension. A specialised visual or add-on handles editing grids and planning scenarios, usually with its own licensing.
- A separate input application. Users enter data in a controlled form or system, and Power BI reports on the result.
Whichever you choose, decide who is allowed to write, where the audit trail lives, and how overwritten values are handled. Write-back also changes your compliance picture: a UK fintech firm subject to GDPR, for example, needs to know whether inputs contain personal data and where they are stored. For finance processes, the notes people add during review are part of the evidence trail, which our article on month-end close review notes and audit trail addresses.
How do you roll out Power BI dashboards so people keep using them?
Treat rollout as a project with its own plan, not as the moment you share a link. A dashboard that nobody opens after week three is a failed dashboard, however clean the model.
A practical rollout sequence:
1. Pilot with two or three leaders. Collect their reactions to the layout and definitions before widening access.
2. Publish to an app or a governed workspace. Give users a single, stable place to find it, and avoid emailing files.
3. Run a 30-minute walkthrough. Show the KPI definitions, the filters and how to read the status colours.
4. Embed it in an existing meeting. The fastest route to adoption is replacing a slide deck or spreadsheet in a recurring review.
5. Subscribe leaders. Microsoft notes you can subscribe to a dashboard, and alerts are available for tiles in certain circumstances, which brings the numbers to people instead of waiting for them to visit.
6. Review usage. Check who is opening it at 30 and 90 days, and retire or rework pages nobody uses. Our guide to finding duplicate workbooks and unused dashboards shows the same audit idea applied to sprawl.
What licences and governance do you need?
Power BI Pro is priced at $14 per user per month and Premium Per User at $24 per user per month (list prices since 1 April 2025). Microsoft's Power BI page also lists a free account and Power BI in Microsoft Fabric as plans. Which one fits depends on how many people create versus only view content, and on whether you need capacity features; the comparison of Power BI Pro, PPU and Fabric licences walks through that choice.
If you plan to use Copilot, note that it requires a paid Fabric capacity of F2 or higher, or Power BI Premium P1 or higher. A Pro or PPU licence alone is not enough, and trial capacities are excluded. Microsoft says Copilot can be asked to add a summary to a dashboard, for example one highlighting why sales spiked this quarter, which makes a clean semantic model even more valuable.
Governance deserves a short list of decisions made before launch:
- Ownership. Name an owner for each semantic model and each report.
- Access. Use role-based access and row-level security so people see only their data.
- Auditability. Microsoft Purview Audit (Standard) keeps audit logs for 180 days, so schedule reviews inside that window.
- Regulatory fit. A US healthcare organisation may need to align access with HIPAA, a US finance team with SOC 2 controls, a UK or EU business with GDPR, and a Canadian organisation with PIPEDA.
Uncontrolled tooling is a real cost. Recent research from Witness.ai found that organisations with high levels of shadow AI faced average breach costs of $4.74 million, compared with $4.07 million for those with low shadow AI exposure. The lesson for dashboard teams is practical: put approved, governed analytics in front of people, and they are less likely to improvise with ungoverned tools. If you are weighing AI features at the same time, testing AI readiness before Copilot is a sensible companion step.
Is Power BI basically Excel, and is it difficult to learn?
Power BI is not simply Excel, although the two share ideas. Excel is a flexible grid for calculation and ad hoc analysis; Power BI is built around a reusable data model, scheduled refresh, shared reports and governed distribution. Microsoft's documentation even notes that tiles can be pinned from Excel, so the tools are designed to work together.
Is it difficult? Viewing and filtering reports is easy for most business users. Building a solid model is harder, because it asks you to think about relationships, filter context and DAX. A sensible split is to let analysts and BI leads own models and measures, while finance and operations managers consume and lightly edit reports. Start small with one dashboard and one audience, prove it, and then extend the model rather than starting again each time.
What are the top Power BI dashboards to build first?
There is no universal top ten, but mid-market teams usually begin with the same few: an executive KPI summary, a sales pipeline view, a finance performance and cash view, an operations or delivery view, and a customer or support view. Pick the one tied to the most expensive decision your leaders make today, build it on the KPI card above, and use it to set the standard for the rest.
---
About Lets Viz: Lets Viz is a data analytics consultancy that has designed Power BI dashboards, data models and governed rollouts since 2020, serving clients across US healthcare, UK fintech, Canadian manufacturing and global SaaS. Our work is reflected in a 5.0 Clutch rating.
If you want help turning these steps into a dashboard your leaders will open every week, talk to our team about Power BI consulting.
Sources
- Introduction to dashboards for Power BI designers (Microsoft Learn)
- Power BI - Data Visualization (Microsoft)
- Power BI service
Facts and prices checked November 2026.